Some crazy price forecast on KLCIAs projected on the chart, follow the movement with the bars pattern.
KLSE trade ideas

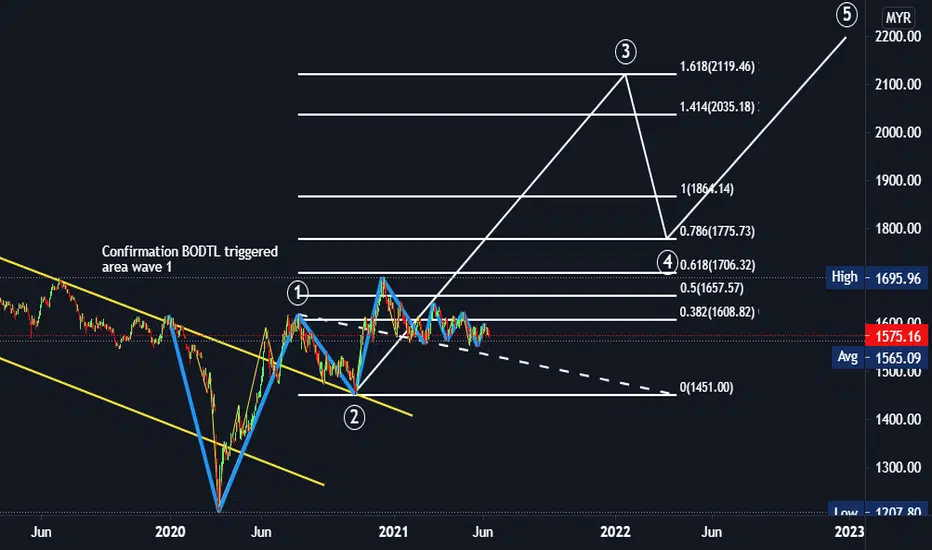
FBMKLCI BURSA CORRECTION WAVE 2 (BODTL)My prediction using method Elliot wave + Fibonacci Extension Retracement + Trendline
Come on Bursa Malaysia Ku. Go go Bursa Ku

KLCI Index 31 July 2021Looking back using term history repeat itself it can be predicted that current situation is similar what had happen on last year
From August till November market is downtrending and rebound at November until mid of December
Next obvious major reversal support previously is at 1452 area with strong upwards movement
Currently bursa is struggling by parliamentary issue instead of covid which has still be in progress and the number of cases counting up around 17k cases daily
If the trend continues downtrending, next support is at 1452 and hope that politic stability will make the market rebound towards recovery phase

Hala tuju indeksKe manakah hala tuju FBMKLCI? Indeks hanyalah indeks, pedagang masih boleh membuat keuntungan walaupun indeks pasaran sendu bergantung kepada kemahiran dan ilmu masing-masing. Namun kajian indeks tetap penting sebagai langkah menyediakan payung sebelum hujan hahahaha #kerajaanderhaka

Gartley patternHow to Trade when you see the Gartley Pattern?
What to consider to enter the trade?
To enter a Gartley trade you should first take note of the pattern and then confirm if it is valid or not. Outline the four price swings on the chart and check to make sure they respond to their respective Fibonacci levels to draw the Gartley pattern on your chart. Ensure you mark every price action swing with the important letters X, A, B, C, and D. By doing this, you will be able to estimate the overall size of the pattern and get a clear idea about the parameters.
If your chat is a bullish Gartley, open a long trade after noticing these conditions:
CD gets support at 127.2 percent or 161.8 percent Fibonacci level of the BC move.
The price action bounces in a bullish direction from the respective Fibonacci level.
If the Gartley pattern is bearish, then you make use of the same two rules to open a trade. But in this case, your trade will to the short side.
Where to set your stop-loss for a Gartley trade?
It is always recommended that you use a stop loss order regardless of your preferred entry signal. By doing this, you will be protecting yourself from any rapid or unexpected price moves. The stop loss order of a bullish Gartley trade should be found below the D point of the chart pattern. But for a bearish Gartley trade, your stop loss order should be found above the pattern’s D point.
What to aim for your take profit for a Gartley trade?
When you open your Gartley trade and you place your stop loss order, you expect the price to move in your favor, right? And if and when it does, you should know how long you expect to stay in the trade.
It is advisable to enter a full position after the D bounce and then scale out at different levels when trading a Gartley harmonic pattern. If the price momentum continues to show signs of strength, you can opt to keep a small portion of the trade open so as you can catch a large move. Use price action clues such as trend lines, support and resistant techniques, candle patterns and trend lines to find the right final exit point. But generally, if the price action shows no signs of interrupting the new trend, just stay in it for as long as you can.

Crab and Deep Crab harmonic patternHow to trade when you see the pattern?
Trading a bearish Crab pattern
To trade a bearish crab pattern, put a short (sell) order at point D (the 161.8 percent Fibonacci extension of the XA leg).
Entry: Identify where the pattern will end at point D, and place your order
Stop-Loss: Put your stop-loss just below point D
Take Profit: The location of your profit target is highly subjective and depends on your objectives and market conditions. If you desire aggressive profit, place it at point A of the pattern. For a more conservative profit, place it at point B.
Trading a bullish Crab pattern
First of all, choose the crab pattern charting tool and follow all the above rules to identify the pattern. Remember that the Fibonacci ratios are very important to trade the crab pattern. If you notice the pattern on a price chart and if you find the ratios not matching with the pattern rules, it means that the pattern is not valid. So do not trade that pattern.
When the price action confirms the pattern, immediately enter for a buy. If you are a conservative trader, ensure you wait for a couple of bullish confirmation candles before entering the trade.
There are four targets (X, B, C, A) to place the take-profit order in the crab pattern. At the start, traders try to book full profit at point A, but when the price crosses point B, the market turns sideways. So book half of your profit at point B and then close your full positions at point A.
Most of the traders placing their stop-loss way below point D; however, that’s a wrong way to do it because they are risking more due to this simple logic. If the price action breaks point D, it automatically invalidates the pattern.

Cypher patternHow to trade when you see the Cypher pattern?
While trading the cypher pattern, you will apply a set of simple rules. They will try to minimize risk and maximize profits. Even though there is one more important step to learn before defining the cypher pattern trading strategy rules.
Step 1: Drawing Cypher patterns
Click on the harmonic pattern indicator located on the right-hand side toolbar of the TradingView platform.
Identify the starting point, X, on the chart, which can be any swing low or high point.
Once you’ve located your first swing high/low point, follow the market swing wave movements.
Every swing leg has to be validated and abide by the cypher pattern forex Fibonacci ratios.
Step 2: Trading process
Now that you know how to identify and qualify the harmonic cypher pattern, it’s time to trade the pattern. Standard methods of trading the cypher pattern include:
Entry point
The cypher pattern may be the most exciting harmonic pattern for risk management, because it has the highest winning rate. Backtesting results have continuously proven the cypher pattern forex is a very dependable harmonic pattern.
Next, buy with a market order at the first candle preceding the completion of the D point at 0.786 Fibonacci retracement of the XC leg. Once the market touches the 0.786 level, wave D is in place, because you can’t control how far the market will go.
When the CD leg gets to the 78.6 percent retracement level, the cypher pattern is complete and valid. However, the 78.6 percent Fibonacci retracement level of X to C also acts as the standard entry point for a valid cypher pattern trade.
Take profit
There are some ways to take profit with this pattern, but the standard method is to scale out of your position at the first take profit level and end the trade at the second take profit level. Take profit once you get to point A. To get to such levels, draw a Fibonacci retracement of the CD leg.
The cypher patterns trading method is a reversal method. Make sure you capture as much as possible from the new trend. If you’re not a fan of reversal strategy, and you prefer a trend following strategy, follow the MACD trend following strategy-simple to learn another strategy. The strategy has attracted a lot of interest from the Forex trading community.
Ensure you take profits once you reach point A of the pattern, because it has conservative take profit target.
So, why should you take profit so early?
For the most part of the harmonic patterns, it’s best to lock in profits as soon as possible. Since the cypher pattern is one of the most profitable harmonic patterns, you can give it more room for the price action to breath. You have the chance to at least see a retest of the wave A.
Stop-loss
Ensure you give your trade at least 10 pips space above X in the intraday charts. While trading a bullish cypher pattern, place the stop-loss at least 10 pips lower than the low of X. For a bearish pattern, place the stop-loss at least 10 pips higher than the high of X. That’s the only logical place to hide your stop-loss, because any break below will automatically invalidate the trade.

Shark patternHow to trade when you see the Shark pattern?
The ideal method used to trade a shark pattern is quite different from that used for other chart patterns. The take profit can be at 50 to 61.8 percent of BC .
The way to trade this pattern is to go in at the open of the next candlestick after the harmonic indicator has detected the pattern. As soon as the C-leg forms, enter the market with a protective stop-loss at the 2.618 extensions of AB swing-leg.
Drawing the pattern
Click on the indicator of the harmonic pattern which can be found on the right-hand side toolbar of the platform
Determine on the chart the starting point 0, which can be any swing high or low point on the chart
After locating the first swing high/low point, follow the market swing wave movements
Traders need to have 4 points or 4 swings high/low points that join together to form the harmonic crab pattern strategy. Each swing leg has to be validated and stick to the Fibonacci ratios of the shark pattern forex.
Trading the pattern
Buy at point D, which has to satisfy the requirement CD = 1.13 OX segment. The D to X can be found anywhere between 0.886 to 1.13, but it is best to take trades using an ideal 1.13 extension.
Stop-loss
The stop-loss can be placed below the 1.150 Fibonacci extensions of XA at point C. As the market begins to go towards the first take profit, move it after D leg. This is the best place to hide the stop-loss because any break below will automatically invalidate the Fibonacci requirements for a shark pattern.
Just as it is with any new pattern, you need to be cautious when trading this pattern. You should only trade the best price structure that fits into all the Fibonacci ratios with great precision. Be picky! The shark harmonic trading strategy works very well as a strong counter-trend strategy.

Bat harmonic patternHow to trade when you see the Bat pattern?
Before trying and trading the pattern, confirm from this checklist that the pattern is real. It should include these vital elements:
An AB=CD pattern or an extension of this pattern
An 88.6 percent Fibonacci retracement of the X-A leg
A 161.8 to 261.8 percent Fibonacci extension of the B-C leg
Next will be to look at how traders can trade using the bat pattern. We will make use of the bullish bat pattern as an example. For a bearish bat pattern, simply do the opposite for your orders.
The first thing to look for when looking for this pattern is the impulsive leg or the XA leg. We are trying to identify a strong move up or down depending if we either have a bullish bat or a bearish bat pattern.
The next thing that needs to be satisfied for an authentic bat pattern structure is a minimum 0.382 Fibonacci retracement of the XA leg and it can go as deep as 0.50 Fibonacci retracement of the XA leg, but it cannot break below the 0.618. This will form the B leg of the pattern.
The next thing traders should do is to look for a retracement of the AB leg up to at least 38.2 percent Fibonacci ratios, but it cannot exceed the 88.6 percent, and this will form the third point C of the pattern strategy.
The last thing to do is to establish is the D point, and to get to the D point, find the 0.886 Fibonacci ratios of the impulsive XA leg, which will lead to a deep CD leg, and finally, it will complete the entire structure of the pattern.
Market strategy
The market strategy of the pattern has been tested across various classes of assets (commodities, currencies, stocks, and cryptocurrencies). It is recommended that traders should take the time and back-test the bat harmonic patterns strategy before using this advanced pattern for trading.
Step 1: Drawing the pattern
Begin by clicking on the bat pattern indicator that is found on the right-hand side toolbar
Identify the beginning point X, which can be any swing high or low point on the chart
After identifying the first swing high/low point, simply follow the market swing wave movements
You should get 4 points or 4 swings high/low points that join and form the harmonic bat pattern strategy
Step 2: Trading the pattern
The 88.6 percent Fibonacci ratio provides traders a more reliable risk/reward ratio which is why the market strategy of the bat pattern is such a very popular as a market strategy. The best entry point is the 88.6 percent Fibonacci retracement which is a very accurate market turning point.
It is recommended that traders should enter as soon as they touch the 88.6 percent figure. Oftentimes the harmonic bat pattern strategy doesn’t go much above this level.
Step 3: Placing a stop-loss
Usually, traders should place their protective stop-loss lower than the point X of a harmonic bat pattern. That is the only logical location to hide the stop-loss because any break below will automatically invalidate the pattern.
Step 4: Take-profit margin
There can be several ways to manage your trades, but the best target for this pattern should be to use a multiple take profit formula. For this pattern strategy, take the first partial profit once you hit wave-C level and the remaining half once we break above wave-A.
By doing this you will accomplish two things:
first, you’ll ensure that you accumulate profits,
and secondly if the markets reverse, you ensure you’re stopped at BE and don’t lose any money.

Alternate Bat harmonic patternWhat is the Alternate Bat harmonic pattern?
The alternate bat pattern is a variation of the Gartley pattern. Scott Carney developed it in 2003. It is popular for incorporating the 1.13XA retracement as the defining element in the Potential Reversal Zone (PRZ). The alternate bat harmonic pattern is one of the most precise trading patterns that works exceptionally great in the relative strength index (RSI) BAMM set up.
How to identify the Alternate Bat harmonic pattern?
The alternate bat is a unique trading pattern that involves certain precise measurements. Those measures are crucial in order to identify the alternate bat. A pattern must meet the following conditions to be an alternate bat pattern:
The first important factor is the B point retracement that must be 0.382 retracements or it must be less of the XA leg.
The alternate bat only utilizes 2.0 BC projections or greater than that.
The AB = CD pattern within the alternate bat pattern always extends requiring a 1.618 AB = CD calculations.
Generally, the best structures use 50% retracement at the midpoint.

Butterfly patternHow to trade when you see the Butterfly harmonic pattern?
Before trading the butterfly harmonic pattern, confirm from the following checklist that the pattern is real. It should have the following vital elements:
AB= an ideal target of 78.6 percent of XA leg
BC= minimum 38.2 percent and maximum 88.6 percent Fibonacci retracement of AB leg
CD= Is a target between 1.618 to 2.618 percent Fibonacci extension of AB leg between 1.272 to 1.618 of XA leg
Entry point
Determine the place where the pattern will complete at point D – this will be at the 127 percent extension of the X-A leg.
Stop-loss
Put a stop-loss just below the 161.8 percent Fibonacci extension of the X-A leg.
Take profit target
The location for placing a take-profit target with this pattern is very subjective and depends on your trading goals as well as the conditions of the market. To have an aggressive profit target, put it at point A of the pattern. For a more conservative profit target, put it at point B.
Trading a bearish butterfly harmonic pattern
Place the sell order at point D (a 127 percent extension of the XA leg). Position the stop-loss right above an extension of 161.8 percent of the XA leg. And place the profit target at A for an aggressive move at B for a defensive move.
Trading a bullish butterfly harmonic pattern
Determine the end of the pattern at point D, which is an extension of 127 percent of the XA leg. You need to put a buy order at this point. Now, below a Fibonacci extension of 161.8 percent of the XA leg, a stop-loss can be placed. Placing a profit target depends on both market conditions and your trading goals.

Scary fate of Malaysia Market FBMKLCIProjection of where the Malaysia Market will go in the near future. Maybe due to the political issue and unresolved Covid-19 issue. The projection been carried out using harmonic pattern which showed 3 possibilities. it can go as low as 300 points lower than current point.

When will the KLCI downtrend end?- the announcement of the extension of FMCO caused KLCI to drop further on Mon (28-May-2021)
- the new stimulus package only gave a temporary relief, KLCI is still dropping below the Bollinger Band
- regardless of your targets for the KLCI, note that it's hard to swim against the tide, especially so when the downward trend is this strong
- sure, there are pockets of opportunity for you to make money here and there, but it seems to be more speculative / operator-driven than any FA / TA will show you
- for now I am moving my funds to the US markets, a rising tide lifts all boats after all

KLCI overall perspective. Updated 5 July 2021Kuala Lumpur Composite Index probably at the beginning of last leg of expanding ending diagonal wave (c) (yelllow) ... which is wave V (green)

2 Types of Chart Pattern2 Types of Chart Pattern are Continuation Pattern and Reversal Pattern as show in the chart.
Continuation Pattern
1. Symmetrical Triangle
2. Triangle
Reversal Pattern
1. Ending Diagonal
2. Expanding Diagonal (Broadening)
3. Channel
For best practices, draw channel and then adjust the 2nd line to confirm either triangle or diagonal.
Example Up trend :
Market Up Trend, draw channel (Bullish / Up trend) by starting draw support trendline as 1st line.
For 2nd line, draw resistance trendline as channel.
Adjust 2nd line to become triangle or diagonal if applicable.
Example Down trend :
Market Down Trend, draw channel (Bearish / Down trend) by starting draw support trendline as 1st line.
For 2nd line, draw resistance trendline as channel.
Adjust 2nd line to become triangle or diagonal if applicable.
Sebagai latihan yang baik, lukis Channel terlebih dahulu kemudian ubah garis kedua untuk dapatkan garis sama ada triangle atau diagonal.
Contoh Up Trend :
Market Up Trend, lukis channel (Bullish / Up trend) dengan melukis support trendline as garis nombor 1.
Untuk garis nombor 2, lukis resistance trendline sebagai channel.
Ubah garis nombor 2 untuk jadi triangle atau diagonal jika sesuai.
Contoh Down Trend :
Market Down Trend, lukis channel (Bearish / Down trend) dengan melukis resistance trendline as garis nombor 1.
Untuk garis nombor 2, lukis support trendline sebagai channel.
Ubah garis nombor 2 untuk jadi triangle atau diagonal jika sesuai.

Malaysian MCO 3.0 effect.Due to Malaysia have decide to run back a total lock down, only some economy areas are open to support sustain the economy. But the inflation and other demands are insisting the economy to fall back in the bearish trend.
Luckily the Malaysian government have make an exit recovery plan, and perhaps all it will work soon.. or the economy impact will be in the bad shape.
When the economy in the bad shape, the recovery will be hard and more difficult to rise back. In the 6 month ahead is the critical economy pull back, And the government must stick to all the plans that have been made to bring back the economy in the psychological area. There still have supports down, but it will be a hard to bounce back when already below the market price.
All the stock market will also impact hard during this session, buying a stock this year is not really worth.
All the best for all Malaysian, and investors..
Be safe, stay at home..

FBMKLCI DirectionAs the index FBMKLCI recently broke down from the Falling Wedge pattern, downside to Fibonacci Projection 23.6% is imminent.
It could be wrong as it could be a bear trap.
Monitor closely.


KLCI: Potential bear trap and spring with likely MCO extensionBanks at resistance. Breakout by CIMB has failed (day not closed yet).
Likely announcement of MCO Phase 1 extension may be caused selldown in bank and other recovery stocks and create a bear trap similar to Nov 2020.


Symmetrical Triangle for Bursa KLCI! Bull or Bear?14th June 2021
The FBM KLCI finished 0.46% or 7.3 points higher at 1,582.46 in line with gains in regional markets. It a good start to the week but also a challenging week. The local political front, uncertain over the outcome from the Agong's meeting with the council of rulers this Wednesday, expect investors to stay sideline waiting for the final outcome.
The KLCI weekly chart, it showing a Symmetrical Triangle . Pray hard to coming Wednesday something positive after the Agong's meeting, most likely the KLCI index would challenge Resistance 1,600 point. But if negative, Index could break Symmetrical Triangle support and go hovering at 1,540-1,550 points.

BURSA INDEX KLCI GOOD FOR INVESTMy prediction BURSA INDEX Malaysia will rebound back soon. Still in sideway wave 2 ZIG ZAG
Method using Wave + Fibo Extension + Trendline BODTL