MMTH 50%MMTH with 50% limit. When the MMTH is below 50% it is likely that there are tensions in the market.

Weekly Outlook Sep 2-6 (Breadth Indicators)In the top chart we have INDEX:MMTH which shows how many stocks are above their 200 D MA expressed as a percentage. When 70% or more of stocks are above their 200 D MA, it can be seen as over exuberance which can lead to a short term decline as investors take profits on riskier stocks to rotate in

next big move yet to come percent of stocks above 200 ema going strong .
means more participants are joining the rally.

Time for SPX to decide whether consolidate or notIf the data hold above the lower line, it is really to stand out

Percentage of stockspercentage of stocks above 200 moving average .
we are getting into a big bull run .
2023 for sure a mega bull run .
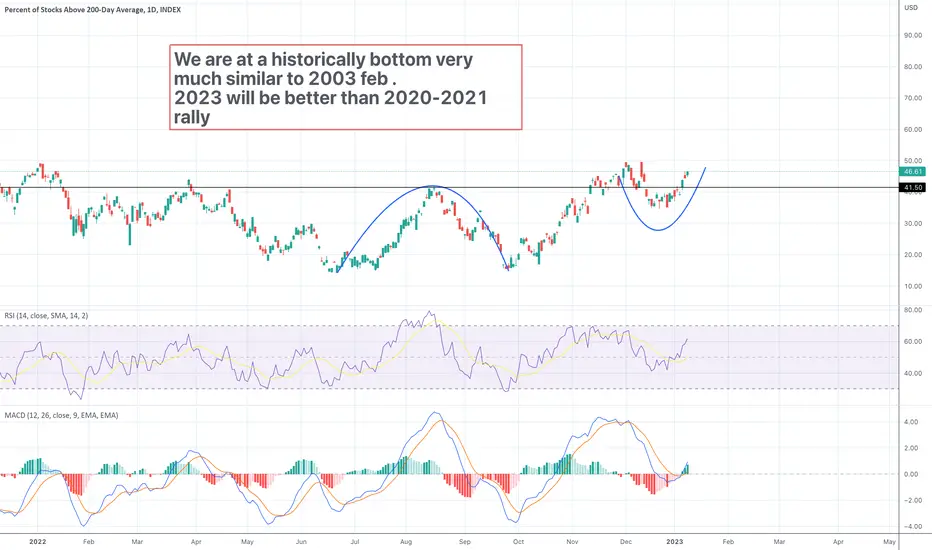
percentage of stocks above 200Ema . Big rally in 2023we are in 2022 and much similar to 2002 bottom .
history repeat itself.
a bigger rally in 2023 , much much bigger than last few years.
followed by a correction in 2024 for few months and then rally will resume.
the age of bear market is over .
more fear leads to bigger bull market

MMTH, about to pull above our yearly high ( 49.17% ) I consider this an indicator of market breadth . Ignore pundits telling you their doomsday predictions and see that stocks above their 200 sma is :
In a stage two uptrend. More confirmation of this needed, could also be a stage one if we don't see follow-through here and pull into a sideways range

Good indicator buy zone of overal arketWhen the candle is in the green sector their good chances to be in a good enter a Long position. INDEX:MMTH

General Market Buy Zone IndicatorThe market can go downside but not much longer than a year. It can go side for much longer.
Patient before entering. For example, it can go deep as 0.7 before a V shape.

U.S. markets up from here? Percent of stocks >200ma is rising.The vertical lines match $SPX lows with times when only 15-20% of stocks traded over their 200ma. The light blue line is a 10-week moving average and you can see that once it turns up it keeps rising (2008-09 was an exception). According to this broad market indicator, stocks have been performing b

See all ideas
Displays a symbol's price movements over previous years to identify recurring trends.