SPX 500 : Correlation between stocks above EMA 200 and US500Just found this idea pretty interesting.
If Avarage of stocks Above EMA 200 falls under about 55/60% usually we have a great SP500 correction.
As always mostly of stocks are susceptible by some type of crisis : Real Estate Crisis, Governament Crisis, War Crisis, Epidemic Crisis.
Quite notable is the rebound to normality, it tooks about 2 periods (vertical bars) or 2.7years.
It start with a Big Drop on average of Stocks above EMA 200 and culminate with another BigDrop quite of the same entity.
SOME CONSIDERATION OVER AVARAGE STOCKS ABOVE 200
Another thing that can be take in consideration is the "average of average of Stock Above 200".
If we stay inside the 50-70% all seems to be quite stable, with a linear growth.
If we are above 70% there is imotivate FOMO, really risky. (Didn't you find quite impossible that 90% of stocks are performing great?? How much it will last?)
If we are below 50%-40% you should consider a SHORT POSITION almost everywhere. And if this happen, maybe, it will retouch the Crisis Starting point...than we can consider Crisis Period finished (maybe).
WHERE WE ARE NOW? WHAT WILL HAPPEN?
Seems we have quite surpassed the first period and so we officially enter in 2nd period.
Things that we must highlight
We are touching 50%, so we have 50% for a last rebound jump in 70% area (unlikely) and 50% for a BIG BIG DUMP
First period is just terminated. What will be in next period? Maybe a small rebounce until spring - fall 2022?
Will Sp500 keep his price or our direction is for 3200-2700$ on late December 2021?
LAST CONSIDERATION
Tapering, money printing, yield, Fomo, Fud, Oil Prices, Hurricanes, Epidemic disease, shortage problems : all those factor are contributing to a big volatily and uncertain.
This week could be crucial to stabilize prices, invert direction... but could be only a correction before the big correction.
Don't become emotional, calculate risk, be calm. Opportunity are always there like a treasure.
MMTH trade ideas

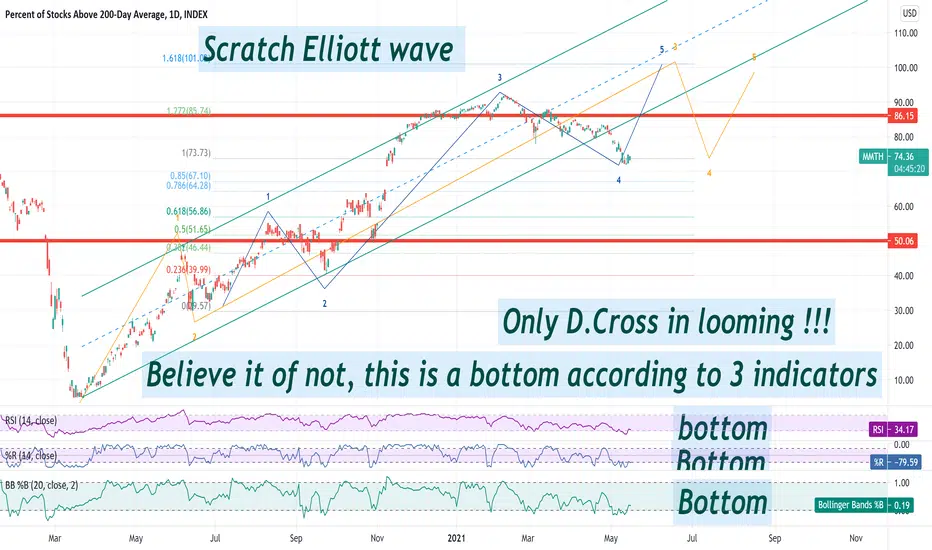
All else equal, believe it or not this is a bottom for SPXVery high risk area to make such a case, like elliott wave top area count. But, data is showing this and i am using
my bias not to accept it ;-) but that will not change the facts presented by the data. The only thing you should
watch for is the previous idea. D.Cross is looming when/where is the question if it even happen !!!
SPX since 2000 Vs. Stocks above 200d MA D.Cross study 76% T.lateToo late to exit in days Early W.System to exit in days
24 22
42
22
36
during a crash
during a crash
53
43
40
19
9
false
53
26
------------------------------------------------------------------------
SUMMERY:
13 Signals. 76 % too late to exit SPX.
15 % Good early warning systems
4 % false signals
Average days 34 / Median 38
-----------------------------------------------------
It would be, 76% of the time , to
late to exit SPX by an:
Average days 34 / Median 38

MMTH Flashing signs of Caution for U.S. StocksLooking at this chart, we have a potential box break down shaping up. This would mean weakness in the equity markets. I'm leaning short as we are below the -1 Bollinger Band. To me, that means down trend.

get ready for the sale, discount could be on the waychart of percentage of stocks over 200 day moving average. chart show many more than usual stocks are above their 200 day moving average. also, volatility and implied volatility is low.

Stocks Above 200d MA tops and bottoms.If you still have doubt that we are starting a new
cycle from march low. Then , check my Elliott
wave counts and SPX's Deviation they are also
suggesting with higher probability a new cycle.
That's been said, we will get 30 % correction
more or less during this cycle, and i guess
even more as we go up and percentages
would be much easier to get.


The Top Is InThis chart is the monthly chart of % of stocks above their 200 Day Moving Average and when it gets to these levels the market will reverse direction. Greed is at extreme and the RISK greatly outweighs the potential return on a portfolio. Now would be the time to tighten up stop losses, reduce positions or outright sell positions as the market is vulnerable to bad news and could collapse quickly.


Percent of Stocks Above Moving Average - Combo Breadth ChartCombination chart of several different Breadth metrics.
Multiple timeframes are used to smooth out false-signals.
$MMTH - % Above 200 Day MA
$MMOF - % Above 150 Day MA
$MMOH - % Above 100 Day MA
$MMFI - % Above 50 Day MA
Best,
RH

Potential Breakout For The Entire Market - Ascending TriangleAscending Triangle on the 200 Day Broad Market. Trend line support shows an area for area for early entry.

The Short Term Bottom Almost Here!We posted this chart back on Feb 28th (see related ideas chart) and we said that we were looking for the number of stocks below their 200 DMA to hit the lows of 2018 before we see a Short Term Bottom. We are now in this area as you can see in the chart (white parallel lines). We are now looking to put Long trades on over the next 1-3 days.

% of stocks above their 200 DMA compared to S&P just trying to get some perspective in regards to finding a bottom - just how deep will this correction / crash run?
Such a great time to be witnessing the market, my gut feeling is we still have a long ways down yet - what do you think?
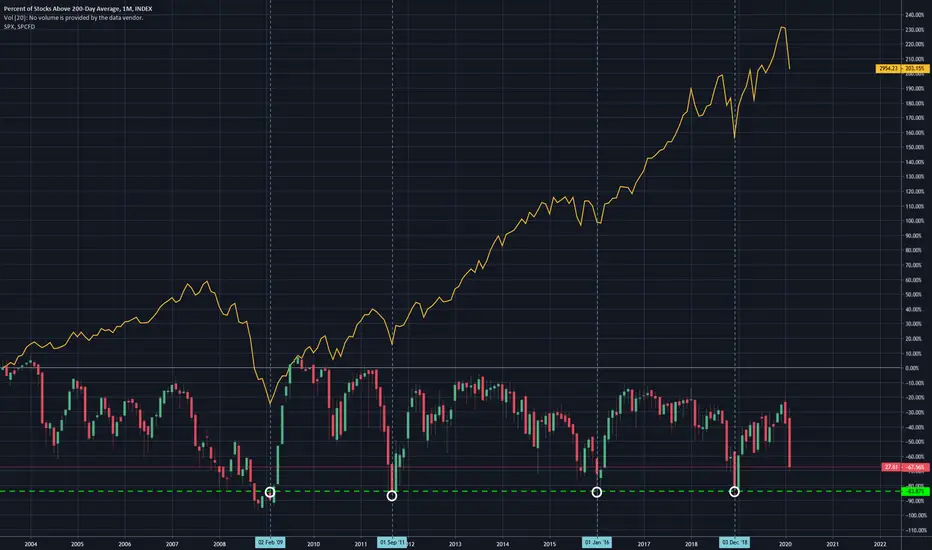
What we're looking for to suggest a bottom is in!Crashes occur when markets are already oversold so there could be more downside from here. One of the indicators we look at is the percentage of stocks above their 200 day moving average to determine if we've hit a short term bottom. As you can see in the chart we entered 2 lines where stocks could be considered extremely oversold. There isn't one indicator that can tell us when the market bottoms exactly but we can look at the overall number of stocks above their 200 dma as a good tell that a rally could be imminent. Let us know what you think.


Total Stocks Above 200MA/SPX Ratio Havent come across are clearer indicator than this. Matches up perfectly with market bottoms in 2003 and 2008. Clearly defined and looks like a small breakout. It appears December 18 may have been the bottom and beginning of a new positive trend. Hard to argue with this ratio.

Stock market at very critical resistance indicator!If we track % of stocks above or below their 200 day moving averages on a WEEKLY time basis - there are some very clear bull market reversal signals as denoted. We are back to a very critical resistance area that once break up, we could see a very sizeable extended multi-year stock market pump. This would in turn seal the deal I believe for a second presidential turn and the Trump re-inflation of the stock market which will eventually lead to a parabolic top most likely.


Will History Repeat Itself Again?Many analysts and investors are shouting for a bear market in 2019.
However, this indicator says otherwise.
For the past 4 occurrences, the S&P bounced and rallied higher.
It happened in 2002, 2009, 2011 and 2016.
Will history repeat itself again in 2019?
We are seeing a lot of interesting phenomenon from a macro analysis perspective going into 2019.
Make sure you follow us on TradingView to get updated whenever we share a new insight of the market.
*Disclaimer - This analysis alone DOES NOT warrant a buy or sell trade immediately. Before you enter any trade in the financial market, it is very important that you have a proper trading plan and risk management approach.
The sharing of this idea is neither necessarily indicative of nor a guarantee of future performance or success.


