S5FI trade ideas


Flash signal, volatility is getting higher . Head winds ahead "STAY NIMBLE"
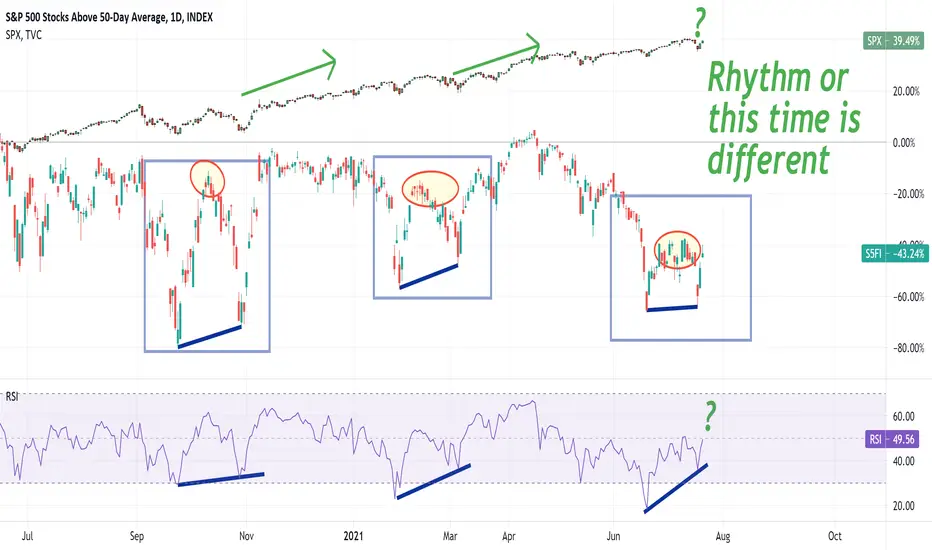
SPX Stocks above 50d Moving average. Very Bad signal popping up.
The death cross is a technical chart pattern indicating the potential for a major sell-off. The death cross appears on a chart when a stock’s short-term moving average crosses below its long-term moving average. Typically, the most common moving averages used in this pattern are the 50-day and 200-day moving averages.
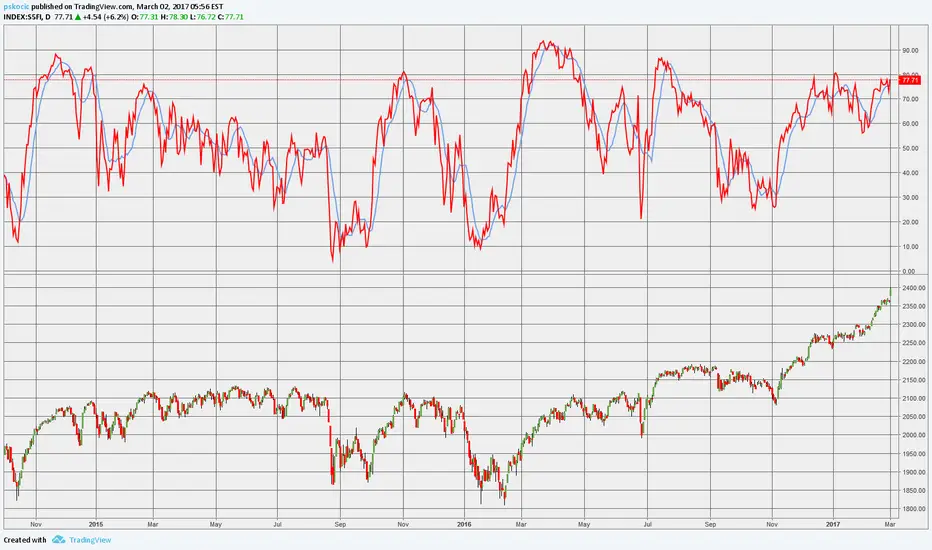
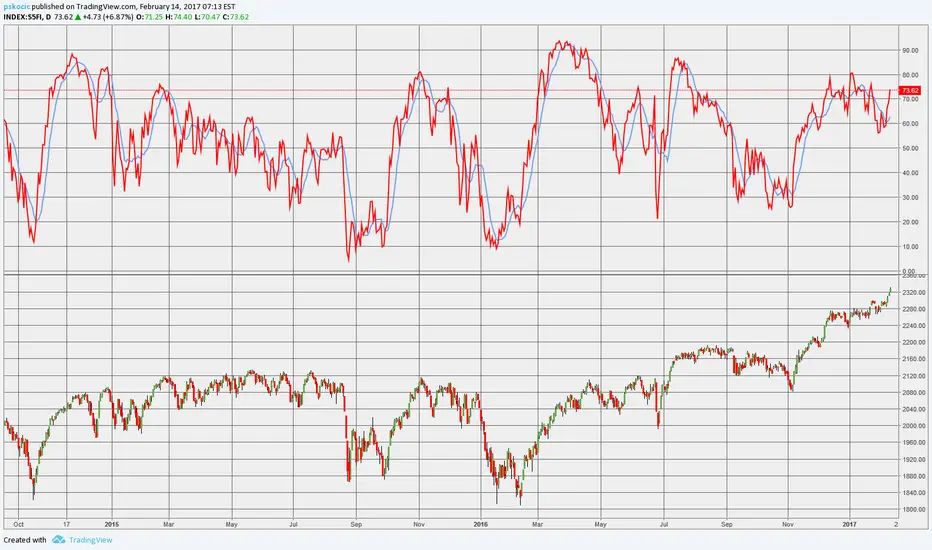
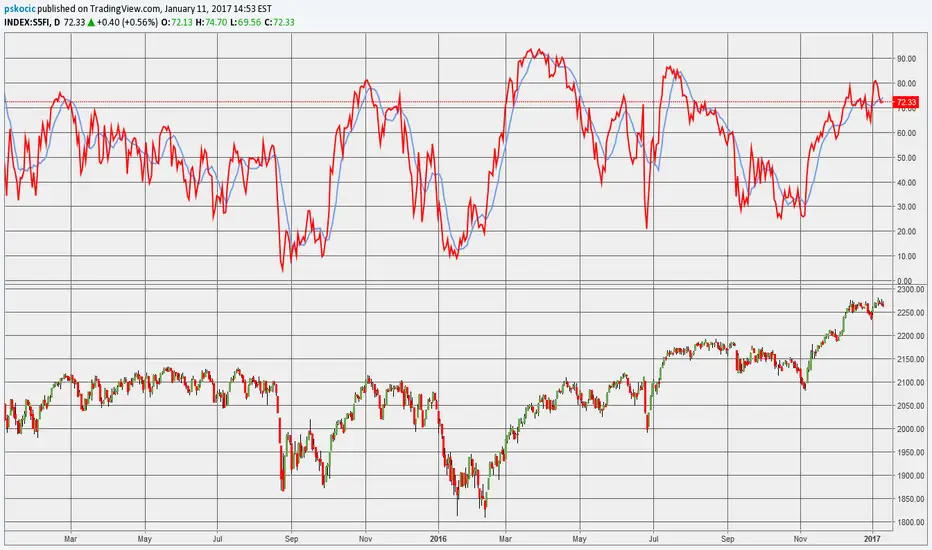
The percentage of stocks trading above a specific moving average is a breadth indicator that measures internal strength or weakness in the underlying index. The 50-day moving average is used for short-to-medium-term timeframes, while the 150-day and 200-day moving averages are used for medium-to-long-term timeframes. Signals can be derived from overbought/oversold levels, crosses above/below 50% and bullish/bearish divergences.


[S5FI] Just Wait and See What Happens Under 50Sitting right on a key fractal in a major downtrend.
This is part of a broader 5Y uptrend fractal break...

Top is S&P stocks above 50 MA, Bottom is the S&P..This can correct through time, but I dont like the look of this. Taking my foot off the gas for now.

SPX Stocks Above 50MA - Fractal of Feb-Mar 2020?February - March 2021 may be a repeat pattern of 2020.


[S5FI] DAMN Guys... We Got a 5Y DIAGONAL Bout to BREAK! B)Notice that every time in the last 5Y we broke below this line, stocks plummeted.
Only options left are...
1. BULLGASM to stay above this line for a bit longer before crashing
2. Start crashing soon
3300 is a good place to pull back to before charging for new ATHs, that is most likely bounce for next downturn right now but 3180 and 3k aren't too far behind, depends on how things shape up.

SFSIHelpful indicator if ur trying to determine where to leg into equities. Gave u the local bottom within a days range over the last couple years. Not all individual things bottom at the same time but index gets you fairly close if ur swinging assets that are a part of it. Also not used as a buy signal rather confluence for a position.

[S5FI] S/R and Entry/Exit Mapped for Stocks Above 50D Average B)For the nerds... enjoy!
Would wait for RSI break before going long.


Time to H.O.L.D F.A.S.T ?I am seeing weakness in stocks with a loss of momentum and volume. There are several interesting red flags I'm observing at this time on many of my indicators.This is just one of many but it shows the percent of s&p stocks above their 50-day moving average. It can serve as a leading indicator and should be observed with a comparison of the index as well as a stoch/rsi or momentum indicator. We can stay in creep mode for a while but I'm expecting a drop soon. I'm not certain if it'll be a lower low (than March) or just a mild 10-15% correction but we should know soon enough. Time to hold fast.