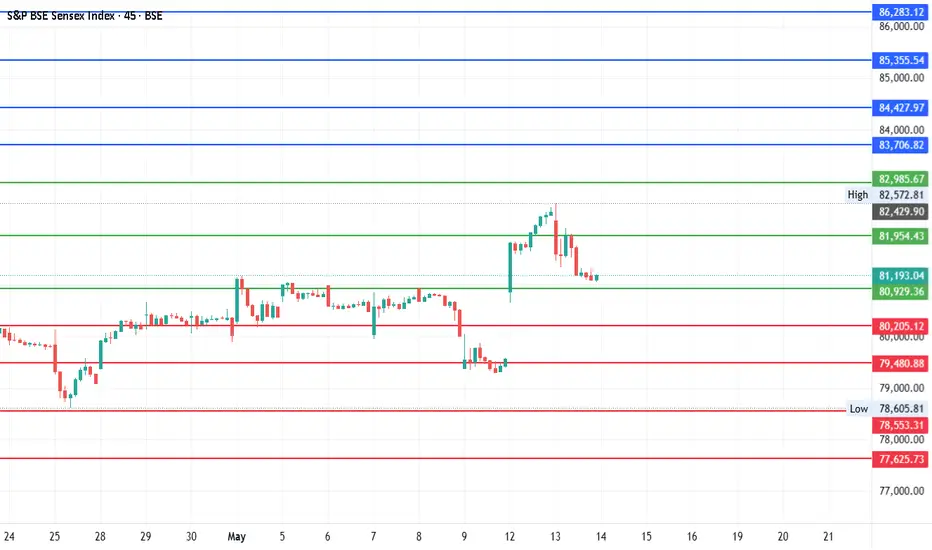
#SENSEX - Another 3500 Points Move?Date: 13-05-25
Current Price: 81148.22
Mid-Point: 81954.425
Upside Targets: 83706.82, 84427.97, 85355.54 and 86283.12
Downside Targets: 80205.12, 79480.89, 78553.31 and 77625.73
Resistance: 82985.67
Support: 80929.3598
#SENSEX
SENSEX trade ideas
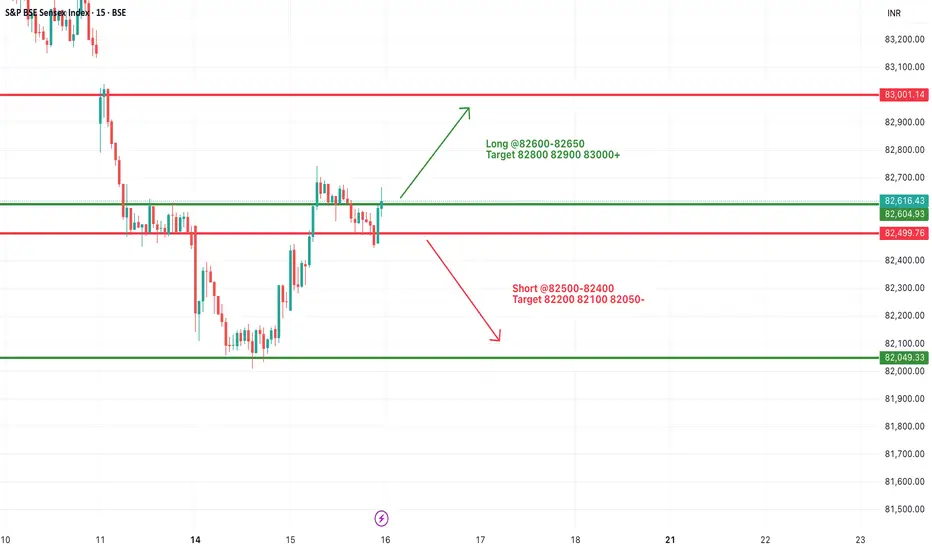
#SENSEX Intraday Support and Resistance Levels - 15/07/2025Sensex is likely to kick off the session with a gap-up opening around the 82500 level, reflecting early bullish momentum. If this initial strength holds and the index begins to build above the 82600–82650 zone, it could signal the start of a recovery leg toward higher resistance levels at 82800, 82900, and potentially 83000+. Sustained action above 82650 may encourage momentum traders to chase strength during the day.
However, the 82500–82650 range will act as a battleground. Failure to defend this zone could invite selling pressure. A breakdown below 82500 may expose the index to intraday weakness, opening downside targets at 82200, 82100, and even 82050. In this case, expect volatility to increase near support levels.
Traders should approach with a flexible strategy—watching for breakout confirmation above 82650 or signs of reversal pressure below 82500. Today’s early range could set the tone for the entire session.

#SENSEX Intraday Support and Resistance Levels - 14/07/2025Sensex is likely to open slightly gap-down, reflecting weakness carried over from the previous session. The index is currently trading near the 82450 zone. A breakdown below the 82400 level may trigger further downside movement, with potential support targets at 82200, 82100, and 82000. This zone should be monitored closely for continuation or reversal.
On the upside, any strong recovery above the 82600–82650 level could push the index higher, with resistance targets at 82800, 82900, and 83000+. Sustaining above this range may indicate buying interest returning in the market.
If Sensex spikes toward the 82950–83000 zone and faces resistance, a reversal from there could create shorting opportunities with targets at 82800, 82700, and 82600. However, a clear breakout above 83000 would negate this short setup and shift the bias to bullish.
The index is currently in a consolidation zone, and price action around 82600–82400 will be critical to determine the day’s direction.

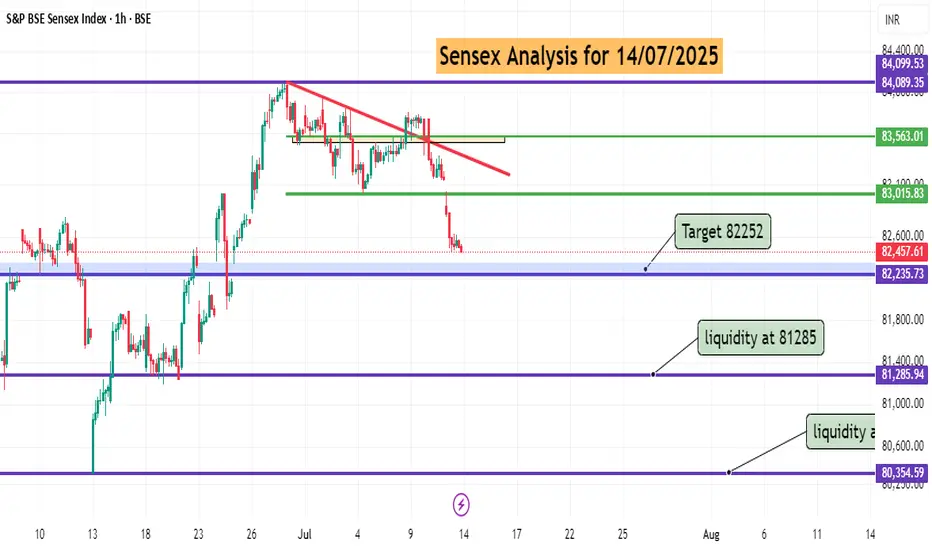
Sensex Technical Analysist for 14/07/2025Strong demand zone is seen near 82219 to 822250 levels. bull may try to enter from here. if market sustain above this level. new buyer will add fresh position at this zone. if bear breaks they will try to grab nest level liquidity at 81285.

SENSEX 1D Timeframe📉 SENSEX Daily Overview (as of July 25, 2025)
Current Price: Around 81,460
Daily Change: Down by approximately 720 points (–0.9%)
Day’s High: About 82,070
Day’s Low: About 81,400
Previous Close: Around 82,184
📊 1-Day Candlestick Analysis
The candle for today is bearish, indicating strong selling pressure.
The price opened near previous levels but faced resistance at around 82,000.
Sellers dominated most of the day, pushing the index toward the 81,400 support zone.
🔍 Key Support and Resistance Levels
Level Type Price Range
Resistance 82,000 – 82,200
Support 81,400 – 81,000
If Sensex breaks below 81,400, the next target could be around 80,500 or 79,900.
If it holds above support and bounces, it could retest 82,200.
🧠 Technical Trend Analysis
Short-Term Trend: Bearish
Medium-Term Trend: Neutral to mildly bullish (as long as above 80,000)
Market Structure: Lower highs forming, suggesting pressure building on bulls
Indicators (assumed):
RSI may be approaching oversold
MACD likely showing bearish crossover
Volume increasing on red candles—indicating strong sell interest
📌 Sentiment & Market Context
Financial stocks (like banking, NBFCs) are under pressure.
Global cues (such as interest rate uncertainty and geopolitical concerns) are impacting investor confidence.
FII outflows and weak earnings in key sectors are adding to bearish momentum.
The broader trend remains range-bound, but with short-term downside bias.
✅ Strategy Suggestions (For Traders & Investors)
Swing Traders: Wait for a reversal candle (like a bullish engulfing or hammer) before considering long positions.
Breakout Traders: Watch for breakdown below 81,000 for continuation of the fall.
Positional Traders: Can wait to enter near 80,000–79,500 if the market holds that key level.
🔄 Summary
SENSEX is under pressure with a drop of 720+ points.
Technical structure suggests caution, especially if 81,000 breaks.
Support: 81,000 – 80,500
Resistance: 82,000 – 82,200
Trap Set at the Top? Sensex Sell-Side Objective = 81,886Sensex is currently trading at 82,220 and showing early signs of a potential sell-side move based on Smart Money dynamics. After grabbing buy-side liquidity above recent highs, we’ve now entered a distribution phase.
Price has shown rejection from a premium zone, and a market structure shift is forming on lower timeframes — all pointing toward a probable move to the sell-side liquidity pool near 81,886.
This zone aligns with Smart Money's objective to tap resting liquidity below recent swing lows before any major reversal. Caution is advised for longs. Wait for confirmation if you're planning to ride the short move with the institutions. 🎯💼

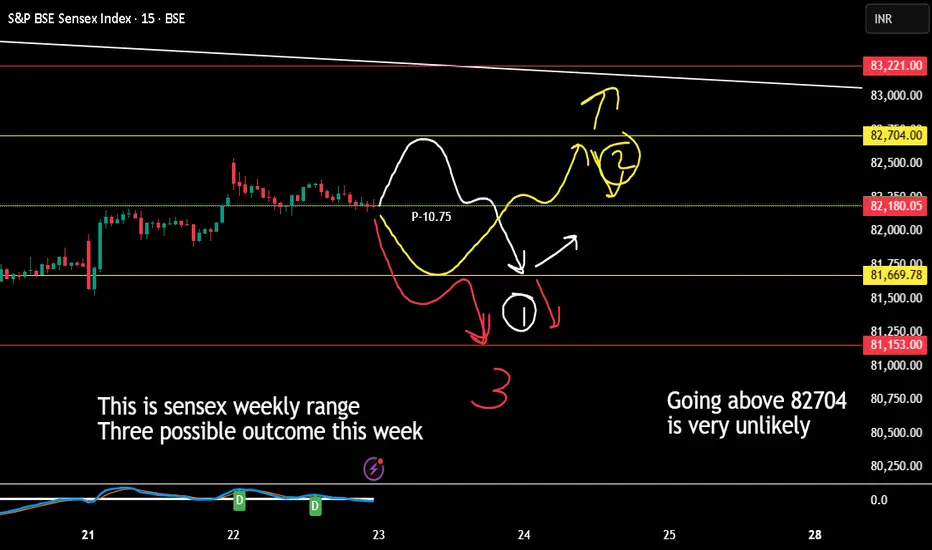
Sensex Weekly Expiry (applicable only till 29th July 2025)1. If Market VIx is less than pivot point then any price coming near pivot line or above is an opportunity to short.
2. Coming to half line below the pivot is highly possible by 80% by 24th July 2025 if not today.
3. That half line point will decide the market direction and any closing below in day to day bassis will indicate weak market.
I am expecting reversal or bulls to enter on 25th july or else by 28th July 2025
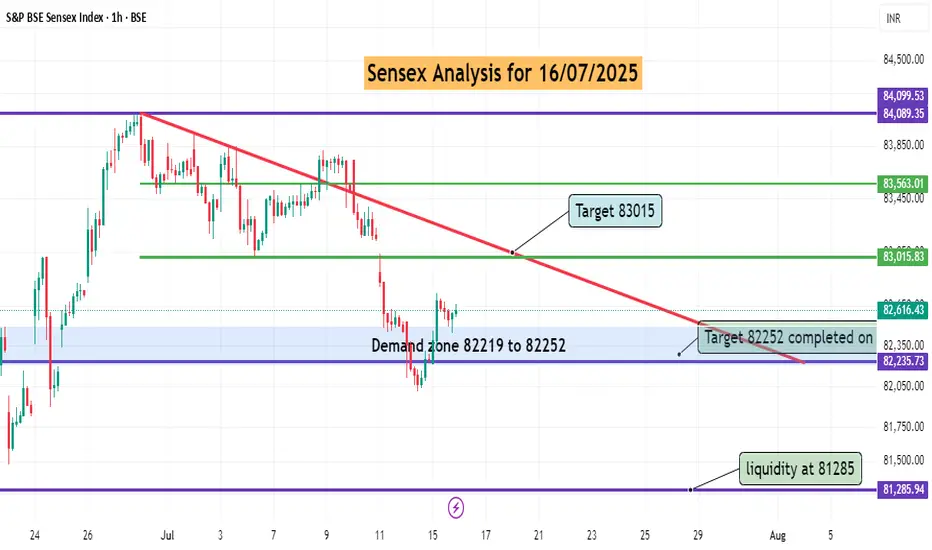
#SENSEX Intraday Support and Resistance Levels - 16/07/2025Sensex is expected to open flat near the crucial 82600–82650 resistance zone, which has acted as a turning point multiple times recently. A sustained move above this range may trigger bullish momentum toward 82800, 82900, and even 83000+. This move would indicate a positive continuation after the recovery seen from recent lows.
However, if the index faces rejection around 82600–82650, it may once again slip below 82500, opening the door for short-side opportunities with targets at 82200, 82100, and 82050. This region has seen a lot of price action over the last few sessions, so volatility may be higher.
sensex Technical analysis for 16/07/2025sensex got support and sustain on 82200 level today which was demand zone. tomorrow expected to touch 8300 level.
Sensex Technical analysis for 14/07/2025Strong demand zone is seen near 82219 to 822250 levels. bull may try to enter from here. if market sustain above this level. new buyer will add fresh position at this zone. if bear breaks they will try to grab nest level liquidity at 81285.
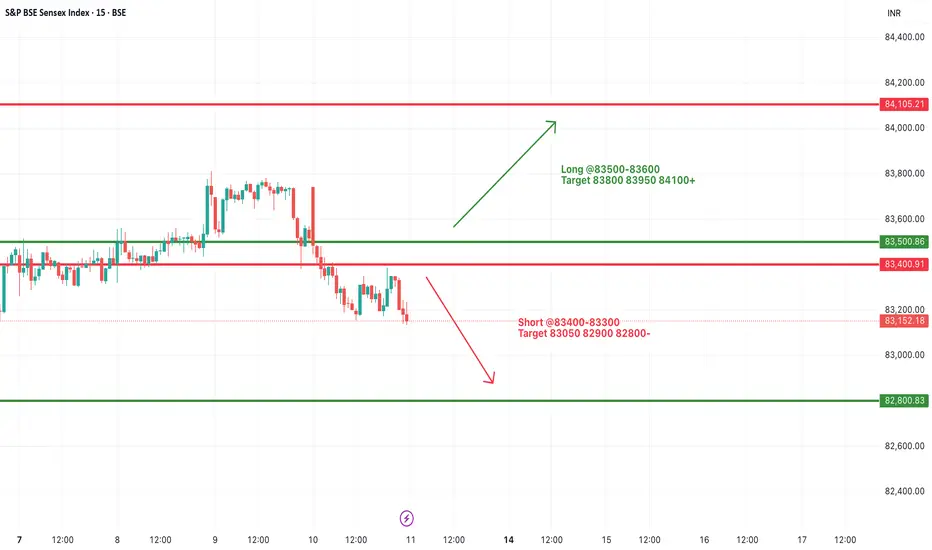
#SENSEX Intraday Support and Resistance Levels - 11/07/2025Sensex is expected to open flat after a consolidation phase and weak closing in the previous session. The index is currently hovering near the support zone of 83400–83300. If Sensex breaks and sustains below this level, further downside may unfold toward 83050, 82900, and 82800. This level should be watched closely as a decisive break may trigger increased selling pressure.
On the upside, a recovery and breakout above 83500–83600 could indicate a potential reversal. Sustaining above this zone can lead the index to rally toward 83800, 83950, and possibly 84100+. However, the price action near this resistance band will be crucial for any confirmation of bullish strength.
Overall, the sentiment remains weak with a bearish bias unless a strong breakout happens on the upside. Traders should remain cautious and focus on these breakout levels for intraday opportunities with proper risk management.
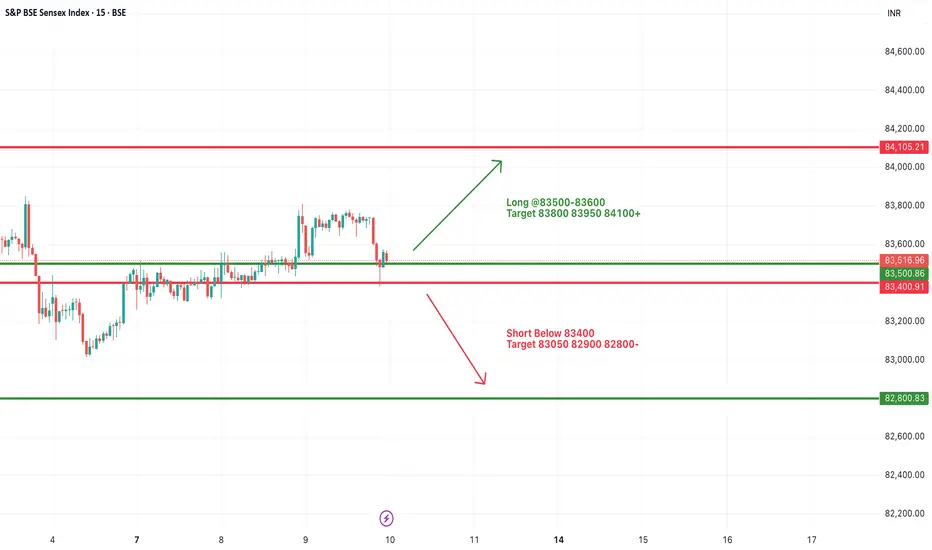
#SENSEX Intraday Support and Resistance Levels - 10/07/2025Sensex is expected to open flat today, continuing the consolidation observed in the past few sessions. The price action remains range-bound with key support near 83400 and resistance around 83600 levels.
Currently, Sensex is hovering near its critical range with buyers and sellers struggling for control. A breakout above the 83500–83600 zone may trigger fresh bullish momentum with targets at 83800, 83950, and 84100+. Sustained movement above 84100 could signal a stronger trend reversal.
On the downside, a breakdown below the 83400 level could lead to weakness, with immediate targets at 83050, 82900, and 82800-.
#SENSEX Intraday Support and Resistance Levels - 09/07/2025Sensex is expected to open slightly gap up near the 83500–83600 range, showing positive momentum as it breaks out from its recent consolidation zone. A sustained move above this level could trigger further upside, with immediate targets seen at 83800, 83950, and 84100+ levels. This zone will act as a crucial resistance-turned-support for the session.
However, if the index fails to hold above 83500 and slips below 83400, it may enter a corrective phase. A breakdown below 83400 could lead to a downward move toward 83050, 82900, and possibly 82800-. Overall, trend remains positive above 83600, and traders should watch for confirmation in the opening session.

#SENSEX Intraday Support and Resistance Levels - 08/07/2025Sensex is expected to open flat today around the 83400 zone, showing no major gap or volatility at the open. The index continues to move in a tight consolidation range between 83300 and 83500. A decisive move outside this zone is likely to give direction to the market.
If the index sustains above 83500, it could lead to a bullish breakout, pushing prices towards 83700, 83800, and eventually 83950+. This breakout may indicate fresh buying interest after a prolonged sideways phase.
However, if Sensex breaches the 83300 level on the downside, it could trigger selling pressure with targets at 83050, 82900, and 82800-. Traders are advised to wait for a clear breakout or breakdown before entering any trades, as the current zone lacks momentum.

BSE Sensex: 3 months Time Frame,. Buy triggered on July 2010
BSE Sensex: 3 months Time frame BUY was triggered on July 2010 ,never looked back
Even During Covid Pandemic also it just managed to stay afloat and ditched a Sell Signal.
( Not a Buy / Sell Recommendation
Do your own due diligence ,Market is subject to risks, This is my own view and for learning only .)

SENSEX ANALYSIS - BIGGER PICTURE for NEXT 5-10-15-20 YEARS - 01-LTP 81451
Resistance: 85979
Supports: 70234/50921/25634 (base support)
As per my analysis, Sensex is in Wave (5) of (3) of (III).
I expect more upside for this move towards 97K first in the long run.
Ultimate last target for this move is around 2.3L
Target zones:
81577-84000-87200
94700-97000
106200
116144-121200-129355
136300
150700-155900-160700
172000
185350-188900-205955
236555

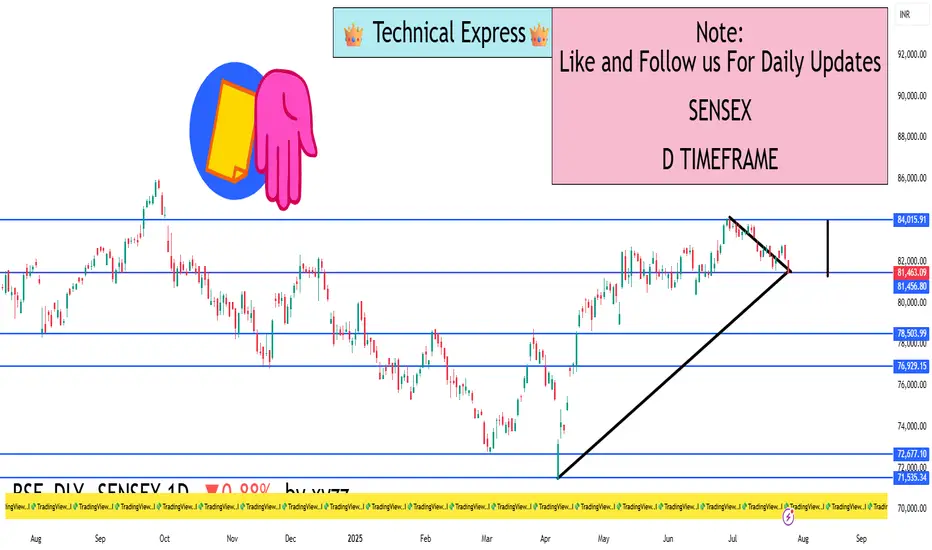
Sensex pending moveSensex weating for breakdown or breakout it's support or resistance trend line lavel

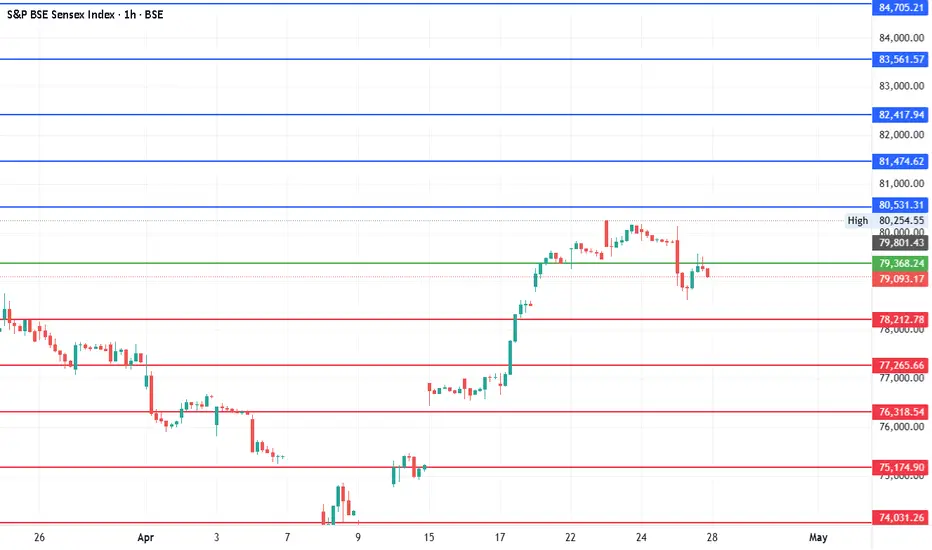
SensexCurrent Price: 79212.53
Upside: 81474.62, 82417.93, 83561.57 and 84705.21
Downside: 77265.65, 76318.53, 75174.89 and 74031.26
Stop loss: 78212.78
Resistance: 80531.31
Sensex Intraday Analysis on May 12, 2025A bearish intraday trend is likely on May 12, 2025. The Sensex may find support at 79,067 (Support 1) and 78,250 (Support 2).
However, gap openings in either direction could invalidate this analysis. Traders are advised to rely on technical indicators before taking positions. Effective risk management remains essential.

SENSEX S/R for 25/4/25Support and Resistance Levels:
Support Levels: These are price points (green line/shade) where a downward trend may be halted due to a concentration of buying interest. Imagine them as a safety net where buyers step in, preventing further decline.
Resistance Levels: Conversely, resistance levels (red line/shade) are where upward trends might stall due to increased selling interest. They act like a ceiling where sellers come in to push prices down.
Breakouts:
Bullish Breakout: When the price moves above resistance, it often indicates strong buying interest and the potential for a continued uptrend. Traders may view this as a signal to buy or hold.
Bearish Breakout: When the price falls below support, it can signal strong selling interest and the potential for a continued downtrend. Traders might see this as a cue to sell or avoid buying.
MA Ribbon (EMA 20, EMA 50, EMA 100, EMA 200) :
Above EMA: If the stock price is above the EMA, it suggests a potential uptrend or bullish momentum.
Below EMA: If the stock price is below the EMA, it indicates a potential downtrend or bearish momentum.
Trendline: A trendline is a straight line drawn on a chart to represent the general direction of a data point set.
Uptrend Line: Drawn by connecting the lows in an upward trend. Indicates that the price is moving higher over time. Acts as a support level, where prices tend to bounce upward.
Downtrend Line: Drawn by connecting the highs in a downward trend. Indicates that the price is moving lower over time. It acts as a resistance level, where prices tend to drop.
Disclaimer:
I am not a SEBI registered. The information provided here is for learning purposes only and should not be interpreted as financial advice. Consider the broader market context and consult with a qualified financial advisor before making investment decisions.

SENSEX FOR LONGVery Important Market Fractal Alert – Be Prepared for All Scenarios
Trust me, I don’t like this setup either…
But if this historical fractal plays out again.
For momentum detection, the indicator implements a Rate of Change (RoC) calculation to measure price momentum over a specified period. It further enhances analysis by incorporating RSI readings for overbought/oversold conditions, volatility measurements through ATR, and optional volume confirmation. When these elements align, the indicator generates trading signals based on the selected sensitivity mode (Conservative, Balanced, or Aggressive).
Key Features & Signals
1. Multi-Period Trend Identification
The indicator combines multiple EMAs of different lengths to provide comprehensive trend analysis within the same timeframe, displaying the information through color-coded visual elements on the chart.
4 863
The Advanced Momentum Scanner is a sophisticated technical indicator designed to identify market momentum and trend direction using multiple exponential moving averages (EMAs), momentum metrics, and adaptive visualization techniques. It is particularly valuable for those looking to identify trading and investing opportunities based on trend changes and momentum shifts across any market and timeframe.
🟢 Technical Foundation
The Advanced Momentum Scanner utilizes a multi-layered approach with four different EMA periods to identify market momentum and trend direction:
Ultra-Fast EMA for quick trend changes detection (default: 5)
Fast EMA for short-term trend analysis (default: 10)
Mid EMA for intermediate confirmation (default: 30)
Slow EMA for long-term trend identification (default: 100)
For momentum detection, the indicator implements a Rate of Change (RoC) calculation to measure price momentum over a specified period. It further enhances analysis by incorporating RSI readings for overbought/oversold conditions, volatility measurements through ATR, and optional volume confirmation. When these elements align, the indicator generates trading signals based on the selected sensitivity mode (Conservative, Balanced, or Aggressive).
🟢 Key Features & Signals
1. Multi-Period Trend Identification
The indicator combines multiple EMAs of different lengths to provide comprehensive trend analysis within the same timeframe, displaying the information through color-coded visual elements on the chart.
snapshot
When an uptrend is detected, chart elements are colored with the bullish theme color (default: green/teal).
Similarly, when a downtrend is detected, chart elements are colored with the bearish theme color (default: red).
During neutral or indecisive periods, chart elements are colored with a neutral gray color, providing clear visual distinction between trending and non-trending market conditions.
This visualization provides immediate insights into underlying trend direction without requiring separate indicators, helping traders and investors quickly identify the market's current state.
2. Trend Strength Information Panel
The trend panel operates in three different sensitivity modes (Conservative, Aggressive, and Balanced), each affecting how the indicator processes and displays market information.
The Conservative mode prioritizes trend sustainability over frequency, showing only strong trend movements with high probability.
The Aggressive mode detects early trend changes, providing more frequent signals but potentially more false positives.
The Balanced mode offers a middle ground with moderate signal frequency and reliability.
snapshot

SENSEX FOR 21 APR#Execution only after break and close above or below from resistance or support 15-minute candle.
#Stop Loss above or below from resistance or support 15-minute candle.
(S/R Levels Will be Flipped in The Situation of Gap up OR Gap down Open, Support Will Turn in Resistance and Resistance Will Turn in Support)
(This Analysis and idea is based only on support and resistance mechanism, Buy after resistance break and close above sell after support break and close below, Closing below resistance after trade will be stop loss likewise closing above support will be a stop loss after trade)
NOTE- Only for Education Purpose. This is not any kind of Trading advice I am giving by this analysis.
NOTE : This is my pre market analysis and my trading journal. Not a suggestion to buy or sell.

Very Strong Zone !Confluence of
1. Fib + 2.Downward trendline +
3. Upward trendline +
4. Horizontal line. +
5. Monthly Supertrend
