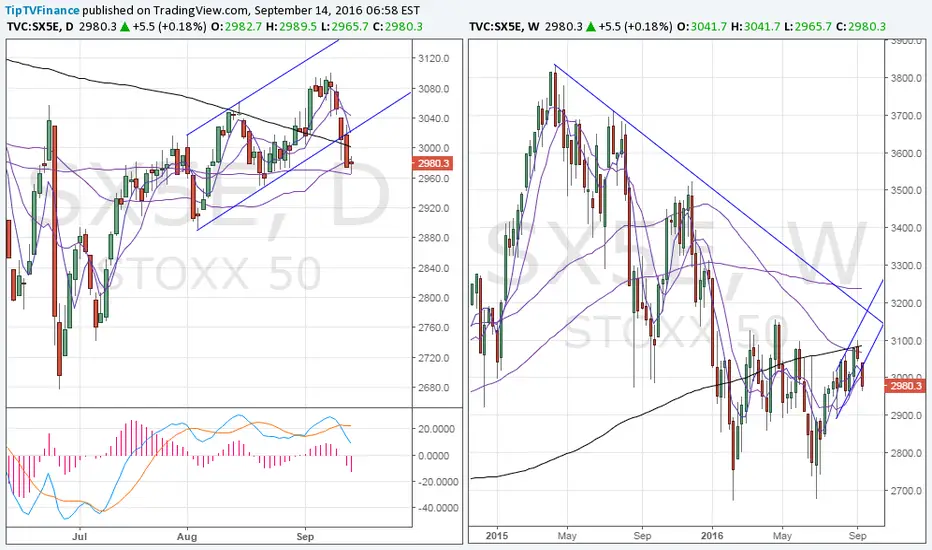
Stoxx50 – Bearish break inside larger falling trendA corrective rally inside a larger descending trend line has officially ended yesterday, given the bearish break from a smaller rising channel seen on the daily chart (on left hand side).
The daily MACD has turned bearish as well, suggesting the upticks are likely to find fresh sellers.
The downside towards 2900 stands exposed and the bearish invalidation is seen only if the index ends the day above 3K levels.
SX5E trade ideas
Hold short until mkt trades below 30504H setup is neutral with bearish bias.
- Market could not push back above Kijun Sen 3041+
- forward Kumo is flat now, may deliver a bearish cross.
- Heikin-Ashi shows indecision again -> doji-like candle, haDelta/SMA3 down.
- EWO is still bearish
I re-sold 0,5 unit this morning. Hold short with 3050 stop. I think we'll see a lower low around 2960.

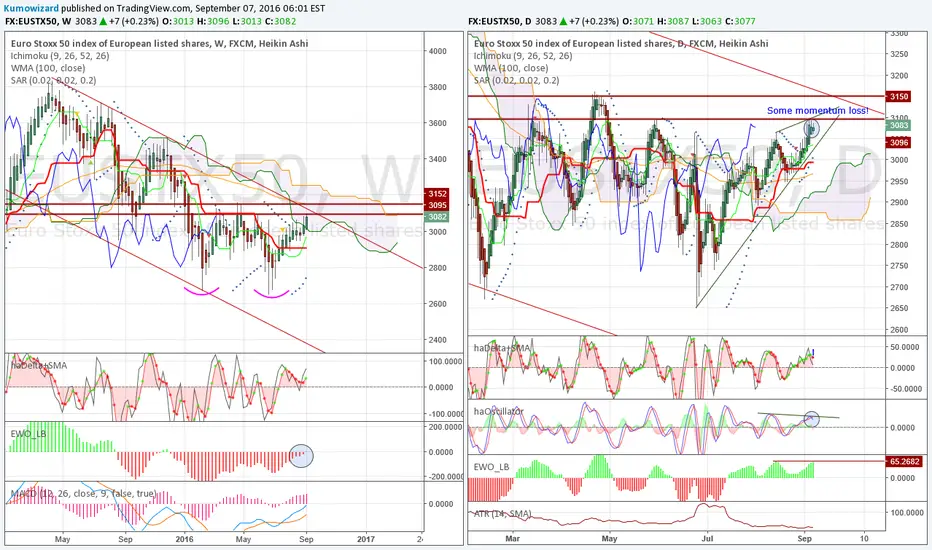
How to deal with resistance zone?Weekly:
- Ichimoku setup is back to neutral
- The long term wide bearish channel is still active. Price got close to trendline (act. at 3125)
- Heikin-Ashi signal is swing bullish.
- MACD is counter bullish, as both the convergence line and signal line are below zero.
- 3095-3150 is a strong support/resistance zone, marked by trendline, Kumo (forward Senkou B) and 100wma
- EWO is neutral too. (ticks to green, but it did the same in November 2015)
Daily:
- Previous idea of possible small Head and Shoulders top did not work. Ichimoku setup is still bullish
- However we have warning signals too, which suggest the risk/reward and P/L upside of long positions from this point may be limited:
1. possible bearish wedge formation
2. Heikin-Ashi signals some exhaustion at 3095, lower level of resistance zone. Candles shrink, haDelta crosse down, today haOscillator crossed down as well
3. haOscillator also has some negative divergence compared to price action (price higher high vs haOscillator lower high)
4. EWO is bullish, but could not post a higher high, despite price moved above previous local high. For those who like wave counts, this suggest that the 5th Elliot wave is done, or will soon be done.
5. Volatility is extremely low. Looking at ATR (14, SMA), its value is stuck below 50 points.
I don't say we have a massive sell signal to go short in big. What I say is that at this level, and in the zone above Bulls will have hard time to push further up. This is not time to buy. Rather time to reduce exposure and take profit on longs.
Something else:
Market has just fallen in love with the idea of further ECB easing. Bond mkt prices another rate cut and announcement of more QE and QE extension. In fact this is something, which the EU Bank index(es) would hate at the maximum. ECB policy is completely killing banking business, if not puts the whole financial system to a huge risk of collapse! Guess what, STOXX50 is not the DAX! This index has more bank weight. What's more, it contains Spanish and Italian stocks. Do you read the news about Italy? Well, I would not be very comfortable to hold and exposure there (neither in S-Pain ;-) ) for the rest of 2016.


Liquidity zone absorbedNice area to watch for a sell opportunity. The price has made a surge up to take its liquidity around the 2950 area.
We might expect a backdown movement for the market to follow its original move.


Zoom in - Really looks like a H&SPls see more details about weekly and daily signals of possible weakness in the previous post.

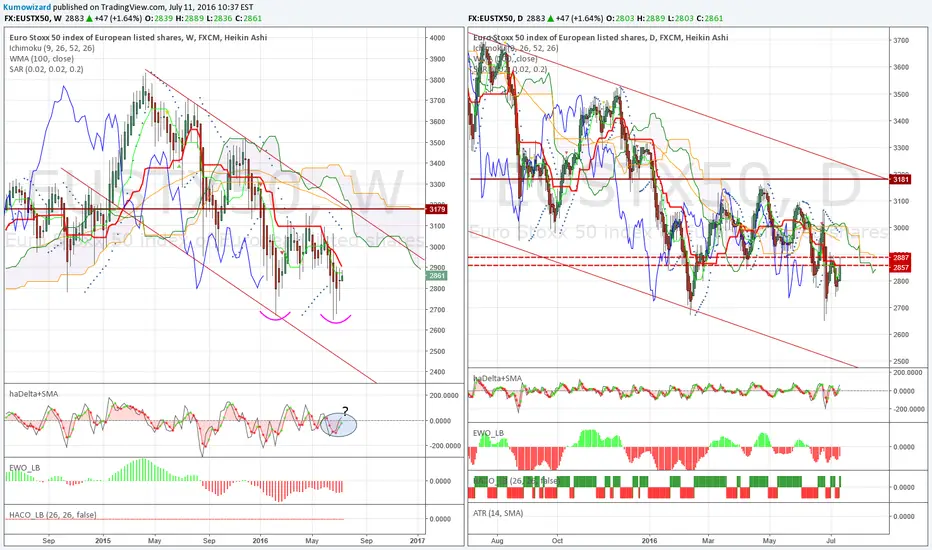
Are these signs of weakness?To be honest, for me STOXX50 is one of the most difficult chart to trade based on my technical approach and model. It has too many swings sometimes, wild rallies and wilder retracements in all direction.
So for now I am just asking, are these signals I see showing us weakness inside market?
Weekly:
- weekly Heikin-Ashi candle shows indecision: small red body with both upper and lower wicks.
- haDelta has been ticking lower for few weeks below SMA3 -> problem with "bullish" momentum
- EWO is still below zero, and it also seems turning down again!
- Major trend is still bearish, with Ichimoku setup being neutral: Price above Kijun, but below Kumo, Tenkan is below Kijun, both avg lines are flat.
- MACD histogram fails to move higher. MACD and signal line still below zero.
Daily:
- Ichimoku setup is still bullish here, but for some reason market just can not get to new highs so easily
- Heikin-Ashi signal seemed to be bullish for few days, but haDelta/SMA3 has some warning. It shows some weakness. Also haOscillator is still below zero.
- EWO is green, but it alo failed to gain momentum so far
- This market likes building Head and Shoulders pattern. Is it just building a minor one now? By break of neckline zone 2925-2950 the validated pattern would point to 2800 measured tgt.
3100 is a sztrong resistance. Real bull market only above that level.


EUSTX50 _ Pure structure trade ! The turning point would be between 2980 and 3010 , due to strong structure levels as horizontal and lines support and resistance are all consolidate at the same zone.

Eurostoxx50 OutlookGood morning traders,
EUSTX50 seems ready for bullish continuation after double bottom and looking at Ichimoku supports the idea.
So Long with SL @ 2850
US Stocks and German DAX also bullish.
Good luck, comments welcome !
You can subscribe to my mailing list for FX Alerts : eepurl.com
6 Trading Rules :
1. Never add to a losing position .
2. Don´t be the first to buy low and sell high ., and don´t be the last one to exit
3. Think like a fundamentalist, trade like a technician .
4. Keep your analysis simple
5. Start small and increase exposure when trend is confirming your analysis
6. The hard trade is the right trade
Josep Pocalles

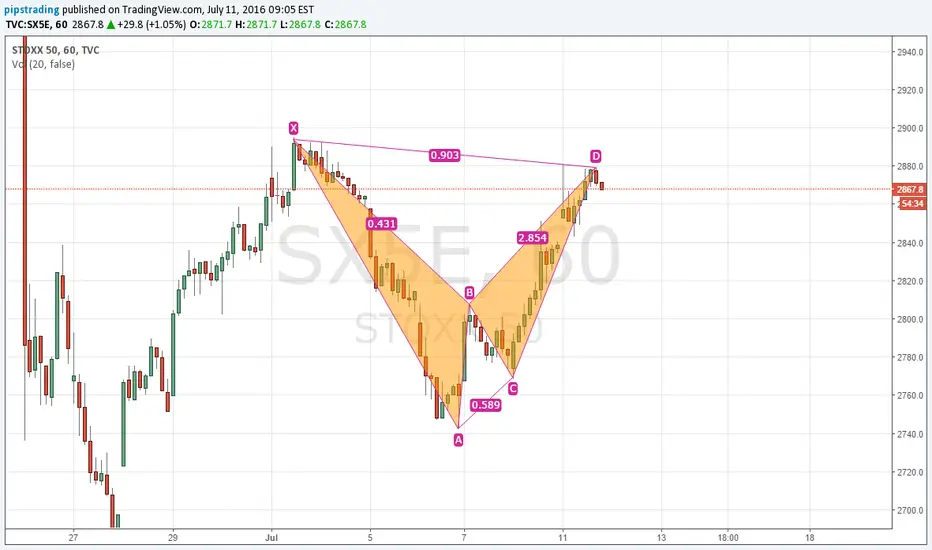
EURO STOXXForming a Bearish Gartley Pattern, finding resistance around the .786XA mark which is also the area of the AB=CD. !.27 BC projection makes up the bottom area of the price reversal zone. Awaiting price action and confirmation.
Any Comments?

MOY0 - EURO STOXX 50 LAST LEG UP BEFORE A BIG DROPEuro stoxx 50 is in the last leg up of a corrective structure, so i'm expecting a new strong leg down to the monthly lower trendline. Bullish divergence for the ABC correction.

EURO STOXX 50 short term buying oppurtunityBy identifying support and resistance and a solidifying uptrend there are bullish opportunities available. TP of 2974 can be achieved if my prediction is correct with an SL of 2955.


EUSTX50 long!!Weekly: At support and mac-d divergence. But it is in downtrend
Daily: Macd cross and daily above kijun. I had small long yesterday and will add on pullback.
EUSTX50 long!!!Took a long yesterday on this too. Weekly is finding supp in highlighted zone and divergences in macd osc. Daily has macd cross as well .Took 0.5 unit so far and if it works, will add more. Lets see how it plays out...

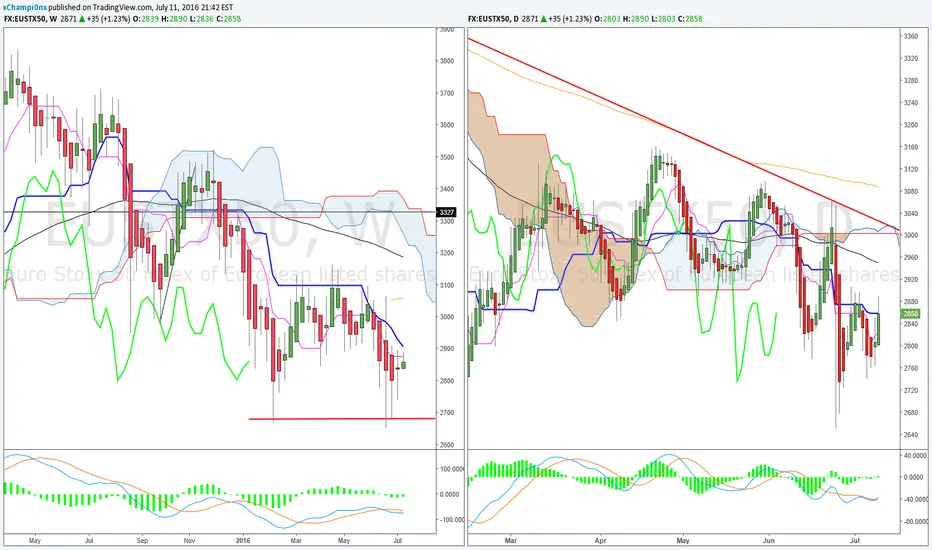
Short term picture improved a bit, long term unchangedWeekly:
- Ichimoku is still bearish. It will be less bearish if price climbs above Kijun at 2900.
- Trend is bearish in a big way. For a real trend reversal market should trade above 3100 and finally above 3180! Then we could talk about a bull market.
- Heikin-Ashi signal is slightly counter bullish, the question is haDelta -> will it be able to move above zero? If yes, then Bulls can get more confidence to test 3000+
- EWO is bearish
Daily:
- Previous Head & Shoulders completed, and interesting that it did so with a possible double bottom. From a higher local low Price is now testing equilibrium zone at 2857-2887. If Bulls hold above Kijun Sen for few more days, then chance to see 3000+.
- Heikin-Ashi signal is swing bullish
- EWO is bearish
Maybe I am wrong, but somehow I just can't convince myself to buy this index... at least not yet.
Euro Stoxx 50: Conditional ShortThis index is already way off its highs.
But, if it drops it a bit lower and then advances to the 3300 area I would likely short it with the hopes of eventually visiting a level just below 2200.
It sounds aggressive and it is but the first wave down is in the 1000 point area.
In my mind the European Monetary Union is a messy minefield and, to an extent, I would be shorting the EMU financial sector as close to 25% of the index comprises such companies which is fine with me.
20/20 I wish I could have recently shorted Chinese and Italian banks. But pulling the trigger will depend upon the prevailing political circus and ECB policies and prospective policies.
A waiting game.
