smashed through 0 on $tickas the chart displays 4hr cumulative tick has swung from the lows to go above 0, and this likely means we are in for a pullback from the lows in the underlying nyse and indices. id wager we hit the upper horizontal if we stay above pivot meaning stocks are climbing, and lower horizontal if we sink below dashed line meaning stockas are falling more than rising on the 4hr.
TICK trade ideas

TICK. P-Modeling Pt A. The TICK_CLOCK of Cajun
\\ TICK_CLOCK // straight into the 4th Industrial Revolution.
.
.
.
.
.
^^
Glitch420

TICK Alerting that indicate institutional Buy/Sell ProgramsIn this video I discuss the ticker "TICK" which is a value indicative of the volume of buy and sell programs running through the NYSE. Usually these are great indicators of when institutional wants to push through resistance and support. Ive also seen them used to set the tone for the day in the morning, and also help close where institutional wants at close. In this video we discuss the theory and how to set up alerts to help us be knowledgeable which way the big boys are bumping the pinball machine and can use it to our advantage.

nyse cumulative expanding rangelosers/gainers looks like it has peaked weekly, but will show an opportunity for more longs after consolidation in the second half of the year

🤖 SELLING PROGRAMS ARE RUNNINGTicks have sustained for the last 45 mis in the -1000 level which is a sign of caution. ↘️
Generally, when we see sustained selling like this it is algos running in the background.
🙅♀️The Fed did not raise rates today - it could have happened but it was unlikely. They did walk back their talk a bit, saying a rate hike would "soon be appropriate" which is a ways of saying they will continue to evaluate the sitaution. All of this should be short term bullish for stocks, ideally into the end of the month. I'll give this a little time to see if there is anything else that makes sense to add here. I want to keep exposure modest.
I am 90% cash and 10% in positions with very tight stops. Do not break rules when volatility expands! ⚠️

If we get a tradable bounce this is the first step🟢 $Tick making new highs and 5SMA on the 5min chart goes positive and is hitting aggressive +1000levels. It has to stay here ange get steadily stronger for a rally. This would give us idea if we will get a bounce into mid week.

Just how bad was the selloff today? Check out TICK.TICK indicator. I use this intraday usually to give me an up-to-the-second sentiment indicator. It shows the stocks trading on an uptick vs a downtick. This chart is just to put today's intraday reversal sell-off into perspective. I had to use the 15m bars to scale out far enough to find the last time the TICK 20 period moving average for 15m increments dropped as low as it did today. Had to go all the way back to Nov 10th. It was THAT BAD. I dimmed out the TICK itself to nearly invisible just for clarity, and left the black line moving average as reference.
The good news? Well.... if there is any, it's that there tends to be a reversal upward after these extreme TICK bombs, as I call them. I overlayed SPX in orange and used the rectangles to show such instances where the TICK bombed, the result it had on SPX, and what happened afterward.
Today reminded me of a short squeeze, but in reverse? A long squeeze? Is that even a thing? I still prefer my "TICK bomb". Sounds more badass.

NYSE TICK - 15 Min Cumulative TICKProvides entry for Scalp in an expanding range with
severe management, no real panic in the Tick @ -1400.
Algos managing the decline to avoid a severe warning.
Buy the Dip and the Media's Mantra is wearing thin, so
Operators will control the Skid.
- 1000 Tick in Trade now.
- 1400 to - 1600 should provide a Low.

NYSE TickSlow Grind all Day
Never really did much but Grind Up and
spit out, Sellers.
It does work quite well.
____________________________________
One Prop Buy after another.

TICK - NYSE 1 HourA complete disaster all day for the US ECONOMY
aka the Equity Complex.
There are far too many depressing comments in
Traders Forums everywhere one looks - claims
of suicide, anxiety, severe depression...
Sad, very sad when people lose hope and it's
hinged to a bunch of Criminal Enterprises.
Unsure when the lesson is learned but apparently
the apathetic cheerleading has turned to Pom Poms
being lit on fire and hatred spewed without any
remorse.
It is, on balance, misdirected as the FED and its handlers
are entirely responsible for creating another Chase with
easy Credit and Ballooning the Supply of Idiocy.
F_cking amazing how the Party... it never ends until
it's too late for Pickle Juice to soothe the Hangovers.
______________________________________________
Swings attempted not to spook, that didn't work
as the Front Run of the ES and NQ's Price Objectives
for the 2/5 RT Fell very short today.
NQ didn't quite make it back to 16170, the Sell
prior to falling 600+ cumulative points.
______________________________________________
A very Weak RT at best.
We'll see where they close it, there is certainly ZERO
reason to attempt to Buy the Dip.
Far too much Risk as "Crashes" occur from Oversold Conditions
and we have those in spades.
________________________________________________
If 3/5 is indeed beginning, look for another 1200 Ticks to
be removed from NQ.
The FED's Policy error is in Full Effect.
Phones will be busy inside the Beltway this weekend.
The "safety" Bid remains Bonds as TLT finally broke it's
prior High to confirm, we are setting up a larger Sell there
as the next round of Prop $ beings to take shape behind the
scenes in DC.
What will they cook up this time...
We'll know the Bottom is in when the FED and DC begin to
phish for even more M@ expansion at an even greater rate
of change.
We're aways from there, by a long shot... patience there as
this Sell can run for a while longer, we estimated 2 to 3 weeks once
it began - it may take a breather, and go again, but it's clear the
overall Trend and momentum are completely Intact.
The Clouds supported this and we would need to see Price make
and attempt to return to the Trend CLouds which will be Charted
this weekend and updated so Trades know Where Price could return.
Commentaries will be updated tomorrow after 12 PM EST.
________________________________________________________
There is far more pain ahead.
________________________________________________________
Have a great weekend everyone, we're checking out for an early weekend.

NYSE TICK - 15 Min Cumulative TICKSelling Pressure has been the order of the Day for the TICK.
We need to see -1400 to -1600 for a low Tick.
That is ahead on Panic.
The High Tic was another Entry into the Day's Trend
@ 10:30 AM EST
It was near the HOD for the ES YM NQ RTY a few minutes
apart on the 1 Minute Tick.

NYSE TICK for TodayRules are contained within the Chart Frame.
The TICK has ranged tightly for the TICK.
Usually, we see larger extremes beyond 1000+ TICKS.
Operators are attempting to Tamp Down VX while grinding higher.
ONLY TICK Extremes are to be bought or SOLD.
A new HOD Tick from 1130 AM EST to 1:30 POM EST can
indicate HIGHER TICKS WILL FOLLOW to 3 PM EST.
The Pelican remains the Pivot @ 3:05 OM EST
A new HOD TiCK will move Price thru HIghs @ 16428 for NQ,
4665 remains Pivot for ES
YM - DOA...
RTY DOA...
NYSE COMP DOA...
16472 is the .618 for NQ on High Tick
___________________________________________________________
B7
APPL + 2.60%
AMZN + 2.47%
MSFT + 2.41%
TSLA + 3.89%
NVDA + 4.61%
GOOG + 2.57%
GOOGL + 2.57%
FB + 1.93%
SMH + 3.30%

Trading Made Easy 11/29 1Took a long after a pull back after confirming direction with the American Affluent Trade Room

NYSE TICK for Reversal this Week / Entry Timing RT's
Timing Entry fro RTs
USE this indicator for entries into a Retracement Potential
intra-Day.
We will see a retracement this week, it is all but assured.
Pricer can head lower First, but we use the Time's Indicated for
Reversals.
A low Tick of the Day between 930 -10 AM EST is usually a good sign
Price will retrace up.
This should be on every Traders Micro Chart, it's been a while since
we've mentioned it.
Fro Reversals it's extremely reliable.

$TICK, Good day too Short or to Fade the Short?As I watch the $TICK today, it seems like someone is selling hard. -1000 tested at least one once on the 5min chart. The question is, to fade or not to fade?

Leading economic indicators vs tick (thanks to shred101)Interesting how we are seeing natural declines. this is a no-good scenario.


TICK Smoking Gun - Hard Support starting Beginning MarchIf you are not familiar TICK is a powerful indicator showing program buying. It shows the up tick vs down tick of the entire S&P market.. Notice it fired up beginning of March and it simply did not stop!
Shortly thereafter it stopped SPY from selling any more past $240 with a hard support nailed in.
Clearly the market will try again, and will fail at the $240.
Do NOT try to short this market against the whale that is buying everything in sight.

Fading $SPX w/ NYSE TICKHow I used NYSE TICK today w/ extremes ~ -1.000: In correction steep DT after news hit the wires 17:36 CET that US is weighing to limit US investors' portfolio flows into China, a move that would have repercussions for billions of dollars in investments pegged to the major indices; also they're apparently pondering delisting of Chinese companies from US stock exchanges (Bloomberg). DJI dives 200 pts in 3 mins; Alibaba plunges 6%, JD.com 5.3%, Baidu 3% (CNBC). Please check the M1 chart for how TICK dived to -1.000 at 17:36 CET, but corrected right next M1, while $SPX was still falling as perfect example for finding the right long entry point.

EMBRACE THE TICK-- SCALPING EXHAUSTION IN /ESWhen I recently mentioned that I largely didn't use a chart when scalping /ES, I got a bunch of queer looks out of people. "I just use TICK," I explain. "You know, TICK?" (NYSE Cumulative TICK). More puzzled looks. There's a lengthy Investopedia definition of the thing, so I won't bore you with those details; I'll just explain how I use it. (Note: I use the 1 min. TICK chart, but have posted the 15 min. here).
I generally look to fade extreme TICK counts of +1000 (long) or -1000 (short). These fades are usually good for four-eight ticks at the least and can sometimes run for several handles. Fading that -1282 opening bell tick (which happened to be the low of the day), could have resulted in your potentially capturing a 20 point move to the upside; fading the +1173 tick (HOD) could have netted you between 8-10 points to the down ... . (Frankly, if I get 6 points out of the session, that's generally it for me, so a 10 point plus day would be pretty nice ... .)
2) Watch price action around the "0" line. Is it being beaten down every time it penetrates to the upside of "0"?; consider shorts on meaningful thrusts above the "0"; vice versa for longs. I generally don't like doing these "0" line rejection trades because where you enter on a brief thrust above/below the "0" line is somewhat subjective. That's when actually glancing at the /ES 5 min. chart might be helpful so that you can get a sense of whether it's making higher highs, higher lows, coming up against support/resistance, session hi/lo, etc. However, I tend to do these a lot in the last hour of the session when there is a good deal of jockeying/whipsaw/choppiness going on of which I can take advantage ... .
Unfortunately, TICK is of limited usefulness since it is an NYSE ticker. In other words, you won't be able to use it for much beyond /NQ and /ES and the like; I use it exclusively to scalp /ES and nothing else ... .
Taste the rainbow. Embrace the TICK.

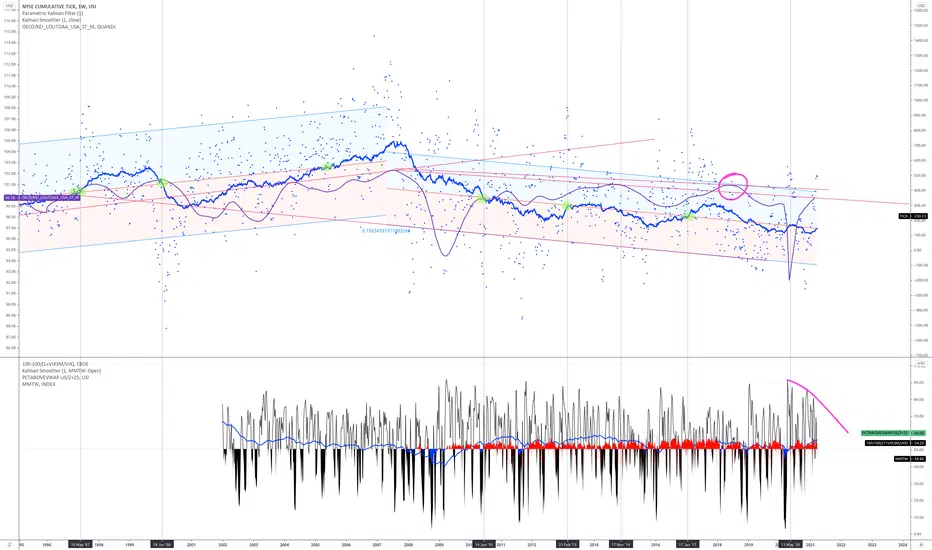
TICK & VIX vs SPYThe tick index measures the very short term health of the markets by taking the difference between the number of stocks on an uptick and the number of stocks on a downtick. The Tick index sums up this difference for all stocks in the New York Stock Exchange.
The goal of the VIX is to estimate the implied volatility of the S&P 500 index over the next 30 days. Since the Financial Crisis of 2008-09, it has been associated as a lagging indicator, and serves you better to invest inverse of VIX extremes. When VIX is at or near all-time lows (10 to 15 / descending lows) it is a good time to bet that the markets will turn negative. When the VIX is at or near all-time highs (40 to 50 / ascending highs) it is a good idea to bet the market will recover.
Measuring the TICK and VIX vs. SPY is another way to guage where the market is headed. As I point out in this chart; the TICK and VIX are giving market participants positive readings. However, with an exception of the previous low volume holiday week (Thanksgiving) and a two day relief rally before US elections, the market has been in a dowtrend -- A downtrend with the VIX near all-time lows -- This can only mean one thing, the S&P (or SPY) has a LOT of room to go further down.
Tick Tock Tick Tock... Waiting for this bomb to explode. Possibly early 2013 -- Feb-Mar
