Get ready for big bull.It look like it is not time to buy INIT.
Look for good entry.
Use proper management.
Take small profit.

INIT (INITIA) PERPETUAL TRADE, Sold at $0.7550INIT (INITIA) PERPETUAL TRADE
INIT SELL SETUP
Currently $0.7550
,
Sold at $0.7550
(Trading plan If INIT go up to $0.79
will add more shorts)
Expecting target $0.7180 OR DOWN
Incase of early exist will update this anaylsis
Its not a Financial advice


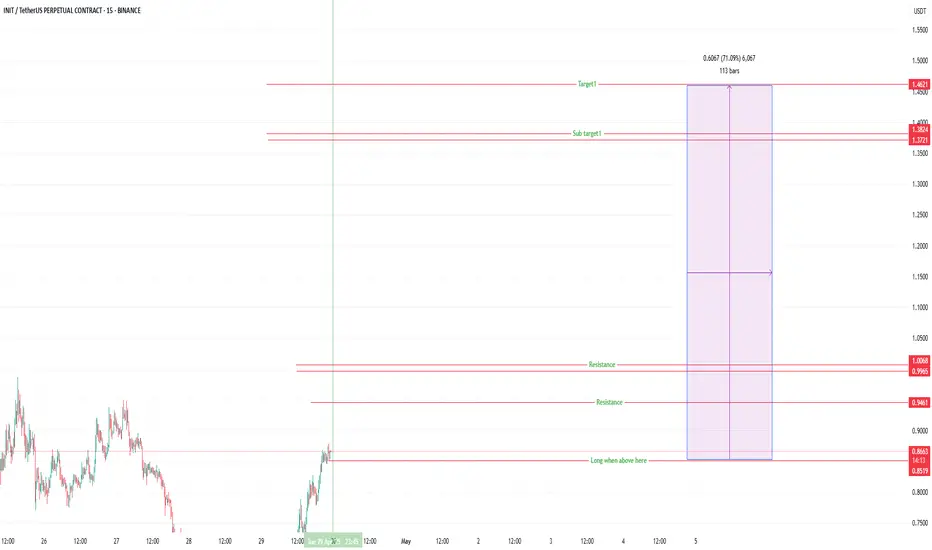
INIT buy/Long Setup (4H)On INIT chart we do not yet have a bearish CH on the chart, and within the substructure, we can look for potential buy/long positions.
There is an unmitigated POI zone, and once the price reaches this area, we can look for buy/long setups.
The targets are marked on the chart.
A daily candle close

$INIT Bearish Trend ConfirmationAnalysis: OMXSTO:INIT is forming lower highs on the 4H chart, confirming a bearish trend below $0.85. The CCI is at -120, indicating oversold conditions, but no bullish reversal is visible. Short on a retest of $0.84, targeting $0.77, with a stop-loss at $0.86.
Key Levels: Resistance: $0.84, $0.86

$INIT High Volatility Signals CorrectionAnalysis: OMXSTO:INIT ’s 24.5% daily range indicates extreme volatility, with the price at $0.85 showing no follow-through after a recovery. The 4H MACD is bearish, and the Parabolic SAR flipped above the price. Short at $0.85, targeting $0.78, with a stop-loss at $0.87.
Key Levels: Resistance: $0.

$INIT Showing Weakness Below $0.85Analysis: OMXSTO:INIT ’s momentum is fading, with the price slipping below $0.85 and the 1H Bollinger Bands contracting, signaling low volatility before a drop. The ADX is weakening (20), showing no trend strength. Short at $0.84, targeting $0.79, with a stop-loss at $0.86.
Key Levels: Resistance:

$INIT Bearish Setup on Resistance RejectionAnalysis: OMXSTO:INIT failed to break $0.85, forming a bearish pinbar on the 2H chart. The Stochastic RSI is dropping from overbought (85), and open interest is rising, indicating short pressure. Short at $0.84, targeting $0.80, with a stop-loss at $0.86.
Key Levels: Resistance: $0.85, $0.86 | Sup

$INIT Testing Critical Support BreakdownAnalysis: OMXSTO:INIT is struggling to hold the $0.85 level, with a 4H chart showing a breakdown below the 20-day EMA ($0.84). The RSI is oversold at 23, but no reversal candle has formed. Short on a retest of $0.84, targeting $0.77, with a stop-loss at $0.86.
Key Levels: Resistance: $0.84, $0.86

See all ideas
Summarizing what the indicators are suggesting.
Oscillators
Neutral
SellBuy
Strong sellStrong buy
Strong sellSellNeutralBuyStrong buy
Oscillators
Neutral
SellBuy
Strong sellStrong buy
Strong sellSellNeutralBuyStrong buy
Summary
Neutral
SellBuy
Strong sellStrong buy
Strong sellSellNeutralBuyStrong buy
Summary
Neutral
SellBuy
Strong sellStrong buy
Strong sellSellNeutralBuyStrong buy
Summary
Neutral
SellBuy
Strong sellStrong buy
Strong sellSellNeutralBuyStrong buy
Moving Averages
Neutral
SellBuy
Strong sellStrong buy
Strong sellSellNeutralBuyStrong buy
Moving Averages
Neutral
SellBuy
Strong sellStrong buy
Strong sellSellNeutralBuyStrong buy