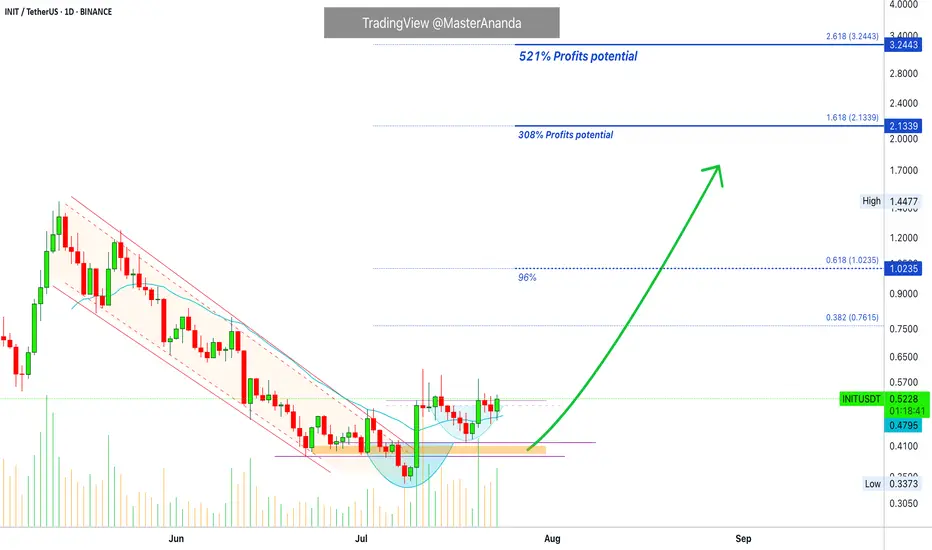
INITUSDT 1D#INIT is moving inside a falling wedge pattern on the daily chart. Consider buying at the current price and near the support level at $0.3992.
In case of a breakout above the pattern resistance, the upside targets are:
🎯 $0.5794
🎯 $0.7291
🎯 $0.8502
🎯 $0.9712
🎯 $1.1435
🎯 $1.3630
⚠️ As always, use a tight stop-loss and apply proper risk management.
INITUSDT trade ideas

INITUSDT at a Crossroads: Bounce or Break Break Down?📊 Comprehensive and Relevant Analysis
On the 12-hour timeframe, the INIT/USDT pair is currently retesting a crucial demand zone between $0.3500 – $0.3685. This zone previously acted as a strong support that triggered a sharp upward move in mid-July.
Now, price is sitting just above the lower edge of that demand box — a critical moment that could dictate the short- to mid-term trend.
---
🐂 Bullish Scenario (Potential Rebound):
Price has tested the $0.35 - $0.3685 zone multiple times and continues to reject further downside.
A micro higher low structure is forming inside the demand zone, indicating that buyers may be regaining control.
If a bounce occurs and price breaks above the minor resistance at $0.4045, the next upside targets are:
$0.4805 – previous consolidation area
$0.5843 to $0.6421 – historical high-volume zones
Confirmation will be stronger if a bullish engulfing, hammer, or volume spike candle forms at this level.
---
🐻 Bearish Scenario (Breakdown of Support):
If price closes convincingly below $0.35, the demand zone will be invalidated.
This could trigger a continuation of the downtrend toward:
$0.3000 – next psychological support
Possibly as low as $0.2650 – the major long-term support
A breakdown will confirm a new lower low structure, validating seller dominance and increasing bearish momentum.
---
📐 Visible Patterns and Structures:
Range Consolidation between $0.35 – $0.48: suggests either accumulation or distribution before a breakout.
Descending Channel on the mid-term structure: indicates a controlled bearish trend.
Potential Double Bottom: if the price bounces and reclaims $0.48, a reversal pattern may play out.
Support Zone Compression: repeated hits to the same support often lead to a break if buyers lose strength.
---
📌 Key Takeaway:
INIT is currently at a decision point. This level is known to precede large directional moves — either a strong bounce or a significant breakdown.
📉 A confirmed breakdown below the demand zone = a strong short setup.
📈 A bullish reaction with volume and reversal signals = a potential buy opportunity.
Traders should wait for confirmation from the next few candles and watch for reaction volume before committing to a position.
#INITUSDT #CryptoAnalysis #DemandZone #BreakoutOrBreakdown #AltcoinWatch #SupportAndResistance #VolumeAnalysis #TechnicalOutlook #PriceActionSetup #CryptoTrend

Initia Breaks Downtrend · 300% Profits Potential Chart SetupHere we have a nice chart setup and we are aiming for 144% short-term followed by 300%+ potential profits. Initia—INITUSDT—broke out of a downtrend 10-July with a full green candle and is already trading above EMA21. This is a solid, easy and simple chart setup.
Notice how the new projects continue moving forward while some of the big projects are stalling or retracing. This simply shows that the overall market continues bullish. If the market were to go on a correction, which develops marketwide, everything turns red.
When some pairs remain green in whatever section of the market, it means that money is simply moving from one sector to the next. After just a few hours, the market continues growing. We will see additional growth in the coming days. All is green, all is good, continue to hold strong. This is only the start.
Namaste.
INTUSDT – LONG RecommendationINTUSDT – LONG Recommendation
Trade Type: Spot or Intraday/Short-term Scalping
Entry: Current price ~$0.5347; accumulate incrementally if price drops lower.
Exit Strategy: Follow Daily timeframe (D1) peaks for closing positions.
Holding Period: Determined by D1 peak cycles (typically intraday or a few days).

INIT | Bullish DivergenceThe INIT/USDT daily chart shows a compelling bullish divergence setup that could signal a potential reversal from the current downtrend.
Bullish Divergence Pattern:
Price has made lower lows while RSI shows higher lows
This divergence often precedes trend reversals
Price is currently testing the descending trendline support
Technical Setup:
Current price around $0.41 near key support level
RSI approaching oversold territory but showing resilience
The projected path (red arrow) suggests a potential move toward the resistance zones
Price Targets:
First resistance: $0.70-0.75 zone (pink box)
Second resistance: $1.12-1.21 zone (upper pink box)
Risk Considerations:
A break below current support could invalidate the divergence
Volume confirmation needed for sustainable reversal
Crypto markets remain volatile with external factors affecting sentiment

#INIT/USDT Potential Bullish Reversal After Down Channel Break #INIT
The price is moving within a descending channel on the 1-hour frame and is expected to break and continue upward.
We have a trend to stabilize above the 100 moving average once again.
We have a downtrend on the RSI indicator that supports the upward break.
We have a support area at the lower limit of the channel at 0.3800, acting as strong support from which the price can rebound.
Entry price: 0.4664
First target: 0.5115
Second target: 0.5579
Third target: 0.6248
To manage risk, don't forget stop loss and capital management.
When you reach the first target, save some profits and then change the stop order to an entry order.
For inquiries, please comment.
Thank you.

INIT/USDT Potential Bullish Reversal After Falling Wedge Break📊 Chart Pattern & Structure
Descending Trendline (Yellow Line): From early May to late June, INIT/USDT formed consistent lower highs and lower lows, creating a strong downtrend structure.
Accumulation Phase: In late June, the price consolidated around the $0.40 – $0.48 range, forming a base and is now attempting a breakout above the descending trendline.
Key Horizontal Resistance Levels (Yellow Dashed Lines):
$0.5843
$0.6421
$0.7546
$0.9193
$1.1766
$1.3828
🚀 Bullish Scenario
If INIT confirms a breakout above the descending trendline, it signals a potential trend reversal from bearish to bullish momentum.
📌 Short to Mid-Term Bullish Targets:
1. $0.5843 – Initial resistance.
2. $0.6421 – Previous support/resistance zone.
3. $0.7546 – Strong resistance with historical significance.
4. $0.9193 – $1.1766 – Mid-term upside targets.
5. $1.3828 – $1.4477 – Long-term target and previous high zone.
📈 Bullish Confirmation Signs:
Increased breakout volume.
Successful retest of the trendline as support.
🐻 Bearish Scenario
If the breakout fails and price falls back below the trendline:
⚠️ Possible Downside Risks:
Rejection back to the $0.4200 – $0.4800 range.
If $0.4200 breaks, price may retest deeper support around $0.3500 – $0.3000.
Breakdown below $0.3000 could lead to a move toward $0.2600 (historical demand).
📐 Pattern Analysis
Falling Wedge / Descending Channel: A typical bullish reversal pattern.
The breakout indicates accumulation and potential impulse movement to the upside.
Aligns with the beginning of a new Elliott Wave cycle (Wave 1 formation).
📝 Strategy Summary
Bullish Setup: Look for a pullback to retest the trendline for a potential long entry, targeting resistance levels step by step.
Bearish Setup: Watch out for a false breakout followed by a breakdown back below the trendline.
#INIT #INITUSDT #CryptoBreakout #FallingWedge #AltcoinAnalysis #TrendReversal #TechnicalAnalysis #CryptoTrading #BullishSetup #CryptoSignals #PriceAction

Init Bearish Entry recently experienced notable bearish momentum
actively interacting with critical liquidity and order flow areas.

$INIT - Long Trade IdeaBINANCE:INITUSDT | 4h
Scaling into long here at cmp, dca around .72-.70
Stoploss: below .64
Targets:
.78-.82
.87-.94
$1 - 1.07

INIT SHORT RESULT Price is still in a major Falling channel as at when trade was executed and also in an overall bearish trend.
Was at the high of the resistance Trendline with low volume and price dumped down as expected.🔥👌
_THE_KLASSIC_TRADER_.

$INITUSDT Breakout AlertINIT just broke out of a falling wedge, a strong bullish signal.
Targeting a 58% move toward $1.4488.
Momentum looks solid. Watch for follow-through!
DYOR. Not financial advice.

INITUSDT 4H AnalysisINIT ~ 4H Analysis
#INIT This trade is very high risk
Buy gradually from here with a short-term target of at least 10%++ from here.

INIT – Missed the Move, Still Watching
Missed the entire move on INIT, but I still see a possible entry.
Will be waiting for prices closer to $1 in the coming weeks.
If it keeps pushing higher, I’ll just sit back and let it go. No chase here.


INIT – The New TIA? 🚀 INIT – The New TIA? 👀
OMXSTO:INIT just broke through key resistance and is now retesting the breakout zone with strength.
Current price: $1.31
Next major level: $1.58 📈
🧠 With a clean structure and explosive momentum, INIT is starting to look like the early days of TIA.
Could this be the next big thing in the altcoin space?
🔁 A healthy retest of the $1.00–$1.10 zone could offer one of the best R/R setups this cycle.
⚠️ Not financial advice, but definitely something to keep on your radar.

Init bullish gartley still in tactSpotted this bullish gartley on init. Had good reaction at the D leg. Still intact. As you can see it’s not totally perfect but is very close so should be a powerful harmonic structure.

INIT (INITIA) PERPETUAL TRADE, Sold at $0.7550INIT (INITIA) PERPETUAL TRADE
INIT SELL SETUP
Currently $0.7550
,
Sold at $0.7550
(Trading plan If INIT go up to $0.79
will add more shorts)
Expecting target $0.7180 OR DOWN
Incase of early exist will update this anaylsis
Its not a Financial advice


INIT buy/Long Setup (4H)On INIT chart we do not yet have a bearish CH on the chart, and within the substructure, we can look for potential buy/long positions.
There is an unmitigated POI zone, and once the price reaches this area, we can look for buy/long setups.
The targets are marked on the chart.
A daily candle close below the invalidation level will invalidate this analysis
Do not enter the position without capital management and stop setting
Comment if you have any questions
thank you

Get ready for big bull.It look like it is not time to buy INIT.
Look for good entry.
Use proper management.
Take small profit.

$INIT Bearish Trend ConfirmationAnalysis: OMXSTO:INIT is forming lower highs on the 4H chart, confirming a bearish trend below $0.85. The CCI is at -120, indicating oversold conditions, but no bullish reversal is visible. Short on a retest of $0.84, targeting $0.77, with a stop-loss at $0.86.
Key Levels: Resistance: $0.84, $0.86 | Support: $0.77, $0.73
Indicators: CCI (-120), Lower Highs Pattern

$INIT High Volatility Signals CorrectionAnalysis: OMXSTO:INIT ’s 24.5% daily range indicates extreme volatility, with the price at $0.85 showing no follow-through after a recovery. The 4H MACD is bearish, and the Parabolic SAR flipped above the price. Short at $0.85, targeting $0.78, with a stop-loss at $0.87.
Key Levels: Resistance: $0.85, $0.87 | Support: $0.78, $0.73
Indicators: MACD (Bearish), Parabolic SAR
