Long Inj 10.4-10.5 longWatch reaction 10.4-10.5 long
Entry: 10.4-10.5
TP1: $10.90–11.00
TP2: $11.20 (moderate)
TP3: $11.50–11.55 (ambitious if volume confirms)
SL: $10.50 (tight) or $10.40 (conservative)
Keep an eye on volume and broader crypto market movements—strength in Bitcoin or Ethereum can give your long more lift. Always follow your risk management rules.
INJUSDT trade ideas

INJ Long Swing Setup – Structural Recovery with SMA ReclaimINJ has retraced to a key support zone and is showing early signs of recovery, reclaiming its 20-day SMA. With structural strength returning, the $11.00–$11.60 range offers a solid swing entry—contingent on BTC holding key levels.
📌 Trade Setup:
• Entry Zone: $11.00 – $11.60
• Take Profit Targets:
o 🥇 $14.00 – $16.00
o 🥈 $19.80 – $23.00
• Stop Loss: Daily close below $9.50 (Exit early if BTC breaks major support)

INJ Long Swing Setup – Breakout Retest Opportunity at Key LevelIf the crypto market pushes higher and INJ flips current resistance into support, we’ll be looking to enter on a retest of the $11.60 zone. This level could act as a launchpad for the next leg up.
📌 Trade Setup:
• Entry Zone: $11.60 – $11.60 (Breakout Retest)
• Take Profit Targets:
o 🥇 $14.20 – $16.25
o 🥈 $19.80 – $23.00
• Stop Loss: Daily close below $10.70

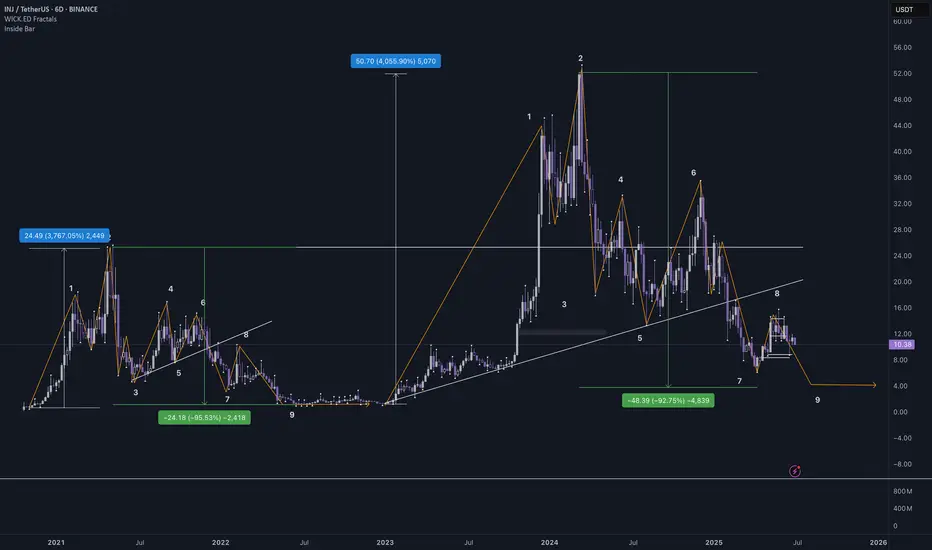
INJ - Back from the Dead?Hello TradingView Family / Fellow Traders. This is Richard, also known as theSignalyst.
INJ has been hovering within a wide range between our two green zones, spanning from $10 to $16.
For the bulls to take control in the medium term, a break above the last major high marked in blue is needed.
To confirm long-term bullish dominance, a breakout above the upper boundary of the green range is required.
📚 Always follow your trading plan regarding entry, risk management, and trade management.
Good luck!
All Strategies Are Good; If Managed Properly!
~Rich

INJUSDTIt seems that we will not see altseason at least this year.
In best case +100%-150% for alts
and 4k for ETH (this summer)
inj swing trade setupInj has broken downside, expecting more downfall before any leg up, wait for the entries to be filled, these are swing trades based on 1 day TF, so here wick doesn't matter wait for the closing, you can hold them without SL if entry achieved, take 1st entry on mentioned points 2nd entry below SL, and then wait for the closing, IF any entry achieved and candle closed above the short then wait for the pullback and close on entry points if long entry achieved then hold the trade 2nd entry take from previous wick low and wait for the tp this leg down will be the final shakeout before any major move. That's why giving you some short entries. BTC will take a final leg down sooner or later, then Boom your alt season starts.

Injective (INJ): Let's Fill Both CME Gaps | Volatility IncomingInjective coin has had a decent upward movement where price left behind a pretty nasty bearish CME gap, which we are intending to see filled here. Once we see the fill of it, we are going to look for BOS, but if we see that buyers will overtake current zones strongly, then we will be looking for an early BOS, which would give us a good entry for long towards upper CME.
Swallow Academy

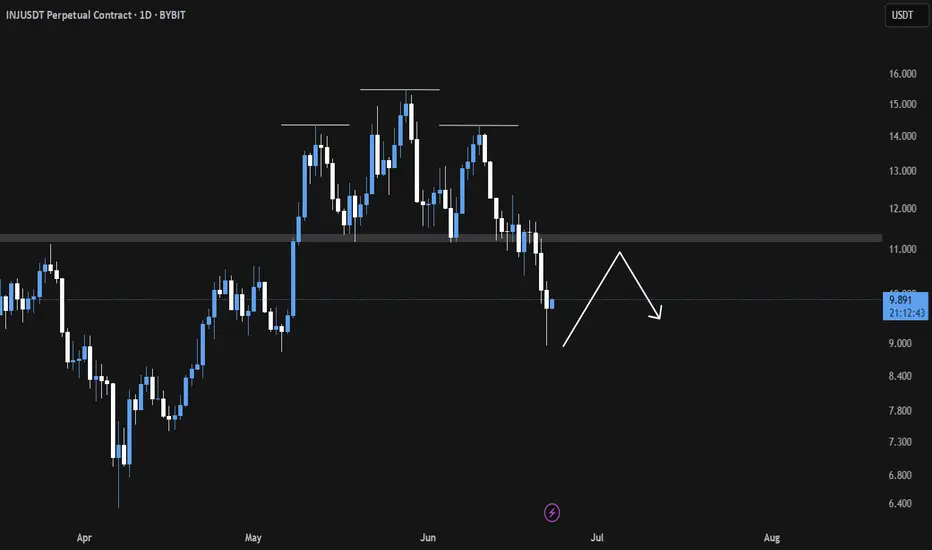
INJ Breakdown in Play Eyeing the Neckline for Precision ShortsINJ/USDT Analysis
〽️ The Head and Shoulders pattern has broken down successfully, confirming a bearish structure.
💠We anticipate a potential relief bounce towards the $11 region which aligns closely with the neckline retest zone. This area is likely to act as a liquidity trap, where institutional sellers may re-enter aggressively 👀.
🎯 Key downside targets remain at
1. $8.98
2. $8.03
3. $6.92
Strategic Plan 🎖️
Look to initiate short positions around the neckline retest near $11, as the risk-reward becomes increasingly favorable from that level.
Trade with discipline. Let the structure lead the execution. 🫡🧠
Injective Enters the Daily Bouncing AreaCRYPTO:INJUSD has tapped into the equal legs zone at $9.99–$8.97, a key Fibonacci-based support area where buyers may begin to step in. This zone often acts as a magnet for a reaction higher, especially if the broader structure supports a bullish reversal.
In the coming weeks, watch for confirmation signals — a strong bounce from this zone could kick off the next leg up.


#INJ/USDT#INJ
The price is moving within a descending channel on the 1-hour frame and is expected to break and continue upward.
We have a trend to stabilize above the 100 moving average once again.
We have a downtrend on the RSI indicator that supports the upward move with a breakout.
We have a support area at the lower limit of the channel at 0.04263, acting as strong support from which the price can rebound.
Entry price: 10.70
First target: 11.11
Second target: 11.43
Third target: 11.86

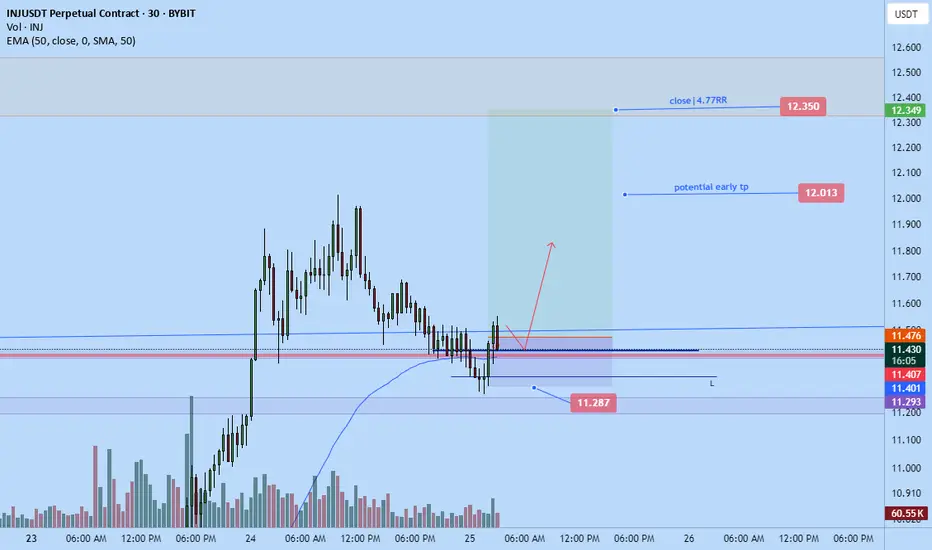
INJ LONg to $12.35I just opened a long position on INJ not too long ago. Targeting $12.35. Anticipating a strong push today. To clear the prior daily LH. Monthly candle closing in a few days and market looks like it wants to close it bullish.
Right now expecting a quick retest on ltf like 15-30 minutes before pump higher
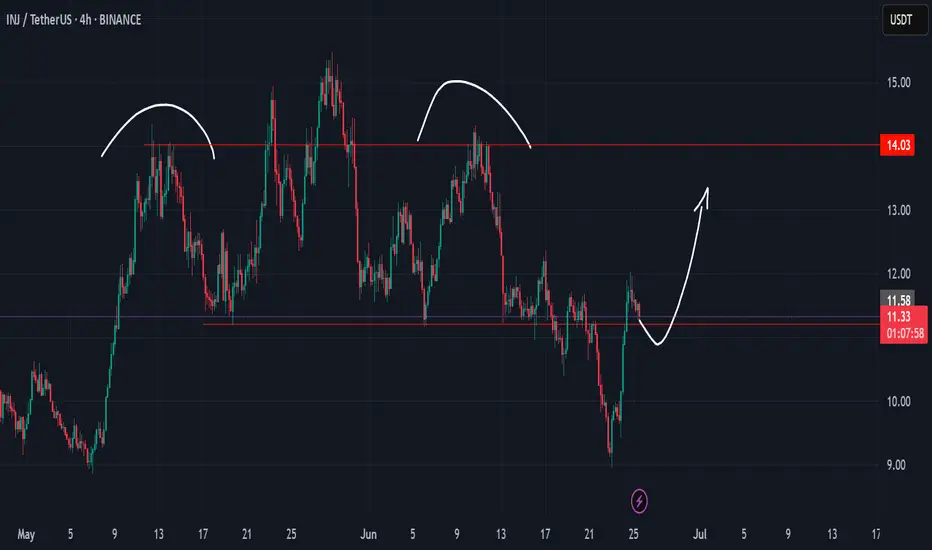
INJ pump it INJ Long
📦 Entry Zone: $11.63 (Marked on chart)
🎯 TP1: $12.11 (Based on the white line)
🎯 TP2: $13.75
❌ SL: $10.74
🧠 Strategy:
✅ Use low leverage
✅ Risk only 2–5% per trade
⚠️ Stick to the plan — no chasing trades.
Discipline = Consistency 💹
TuffyCalls Team

INJ short to $10.974Just now opened a new short position on INJ.
Targeting $10.974
Roughly 2.6 RR.
I anticipated some demand to come in around that area and I might not be available to monitor so exiting there.
Time sensitive

INJ short to $11.572Recently opened a short position on INJ. Might not be too late for anyone wanting to hop on. Still can get like 2RR+ from the move.
Time sensitive
market aiming for prior weekly resistance to potentially use as a new HL structure.

Injective (INJ): Important Neckline ZoneINJ is at a crucial area where we are testing the local neckline area, which will give us the next major movement on the coin.
Now we are divided in two ways here. Once we see a breakdown, we will aim for a lower target area, but if we see a proper bounce from here, we will be aiming for the upper target zone. Basically, it is all about who will take full control over the current zone so wait for a proper breakdown for short or a proper MSB for long.
Swallow Academy

INJ: Spot TradeTrade Direction:
Injective Spot Long
Risk Management:
- Spot Position 1% total spot portfolio.
- SL will be executed only when a daily / 3day close below that level.
Reason for Entry:
- 50% retracement off daily leg completed
- EQLs swept and reclaimed
- Daily CHoCH/MSB with retrace
- Injective oversold daily with likely daily bullish divergence forming
- Multiple fair value gaps tapped: daily, 3-day, weekly — strong support confluence
Additional Notes:
- Plan to layer bids in and slowly dca in even if that means higher up
- If this low is confirmed as a protected level, stop to be moved tighter as trade progresses
- Daily time frame change of control favours bulls, supporting long bias
Only coin I'm interested in at these levels. Begun building a spot position here.

INJ: Long Idea 15/06/25Trade Direction:
INJ Long
Risk Management:
- Risk halved because of weekend
- Halved again as counter HTF trend (Bearish)
Reason for Entry:
- BTC retrace into OTE of H1 Leg and looks primed for my target on that long at $106,300 - $106,500
- Double Bottom
- Price starting to move out of oversold on multiple timeframes
- Failure to displace lower
- HTF Support.
Additional Notes:
- Target second daily FVG with a flat candle.
- Probably one of the weaker alts and if btc rolls over this will get stopped.
- Double bottom could be read as EQL which could get swept
- Losing the double bottom would invalidate this idea
BTC Technical Analysis for Beginners | Bitcoin Trading Are you new to crypto trading? In this beginner-friendly video, BTCguruonline breaks down the basics of Bitcoin (BTC) technical analysis—from understanding charts to using indicators like RSI, MACD, support & resistance, and more.
What You’ll Learn:
What is Technical Analysis?
Entry & exit strategies
Whether you're a complete beginner or just looking to improve your crypto skills, this video is your starting point!
📌 Don’t forget to LIKE, SHARE, and SUBSCRIBE for more crypto analysis and trading tips.
💬 Got questions? Drop them in the comments — BTCguruonline is here to help!
🔔 Turn on notifications to stay updated with our latest BTC & altcoin analysis.

$INJ to re-enter my buy zone? $11.12 must hold!Altcoins are experiencing another pullback.
CRYPTOCAP:INJ had a solid pump recently, but it’s now facing a significant drop.
This could be a good buying opportunity — assuming we’re not entering a bear market.
Key level: $11.12 must hold.
If it breaks, the next major support is around $9.10.
While the macro trend remains bullish, this retracement is concerning.
Set your stop losses accordingly.
DYOR.
#INJ #Altcoins #CryptoTrading #MarketUpdate #CryptoAlert #BuyTheDip #DYOR


INJUSDT I Weekly CLS I Short in the Model 2 zoneHey, Market Warriors, here is another outlook on this instrument
If you’ve been following me, you already know every setup you see is built around a CLS Footprint, a Key Level, Liquidity and a specific execution model.
If you haven't followed me yet, start now.
My trading system is completely mechanical — designed to remove emotions, opinions, and impulsive decisions. No messy diagonal lines. No random drawings. Just clarity, structure, and execution.
🧩 What is CLS?
CLS is real smart money — the combined power of major investment banks and central banks moving over 6.5 trillion dollars a day. Understanding their operations is key to markets.
✅ Understanding the behavior of CLS allows you to position yourself with the giants during the market manipulations — leading to buying lows and selling highs - cleaner entries, clearer exits, and consistent profits.
📍 Model 1
is right after the manipulation of the CLS candle when CIOD occurs, and we are targeting 50% of the CLS range. H4 CLS ranges supported by HTF go straight to the opposing range.
"Adapt what is useful, reject what is useless, and add what is specifically your own."
— David Perk aka Dave FX Hunter ⚔️
👍 Hit like if you find this analysis helpful, and don't hesitate to comment with your opinions, charts or any questions.
