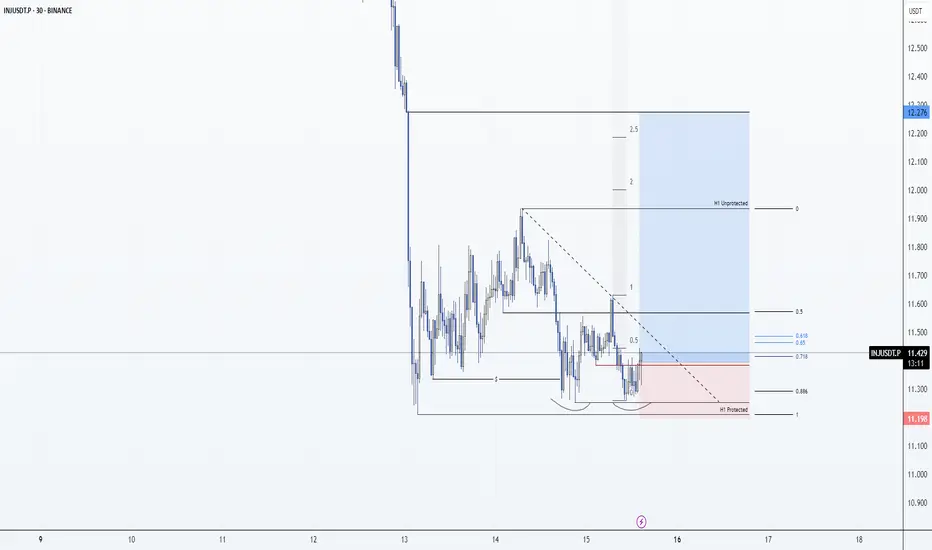
INJ: Long Idea 15/06/25Trade Direction:
INJ Long
Risk Management:
- Risk halved because of weekend
- Halved again as counter HTF trend (Bearish)
Reason for Entry:
- BTC retrace into OTE of H1 Leg and looks primed for my target on that long at $106,300 - $106,500
- Double Bottom
- Price starting to move out of oversold on multiple timeframes
- Failure to displace lower
- HTF Support.
Additional Notes:
- Target second daily FVG with a flat candle.
- Probably one of the weaker alts and if btc rolls over this will get stopped.
- Double bottom could be read as EQL which could get swept
- Losing the double bottom would invalidate this idea
INJUSDT trade ideas
BTC Technical Analysis for Beginners | Bitcoin Trading Are you new to crypto trading? In this beginner-friendly video, BTCguruonline breaks down the basics of Bitcoin (BTC) technical analysis—from understanding charts to using indicators like RSI, MACD, support & resistance, and more.
What You’ll Learn:
What is Technical Analysis?
Entry & exit strategies
Whether you're a complete beginner or just looking to improve your crypto skills, this video is your starting point!
📌 Don’t forget to LIKE, SHARE, and SUBSCRIBE for more crypto analysis and trading tips.
💬 Got questions? Drop them in the comments — BTCguruonline is here to help!
🔔 Turn on notifications to stay updated with our latest BTC & altcoin analysis.

$INJ to re-enter my buy zone? $11.12 must hold!Altcoins are experiencing another pullback.
CRYPTOCAP:INJ had a solid pump recently, but it’s now facing a significant drop.
This could be a good buying opportunity — assuming we’re not entering a bear market.
Key level: $11.12 must hold.
If it breaks, the next major support is around $9.10.
While the macro trend remains bullish, this retracement is concerning.
Set your stop losses accordingly.
DYOR.
#INJ #Altcoins #CryptoTrading #MarketUpdate #CryptoAlert #BuyTheDip #DYOR


INJUSDT I Weekly CLS I Short in the Model 2 zoneHey, Market Warriors, here is another outlook on this instrument
If you’ve been following me, you already know every setup you see is built around a CLS Footprint, a Key Level, Liquidity and a specific execution model.
If you haven't followed me yet, start now.
My trading system is completely mechanical — designed to remove emotions, opinions, and impulsive decisions. No messy diagonal lines. No random drawings. Just clarity, structure, and execution.
🧩 What is CLS?
CLS is real smart money — the combined power of major investment banks and central banks moving over 6.5 trillion dollars a day. Understanding their operations is key to markets.
✅ Understanding the behavior of CLS allows you to position yourself with the giants during the market manipulations — leading to buying lows and selling highs - cleaner entries, clearer exits, and consistent profits.
📍 Model 1
is right after the manipulation of the CLS candle when CIOD occurs, and we are targeting 50% of the CLS range. H4 CLS ranges supported by HTF go straight to the opposing range.
"Adapt what is useful, reject what is useless, and add what is specifically your own."
— David Perk aka Dave FX Hunter ⚔️
👍 Hit like if you find this analysis helpful, and don't hesitate to comment with your opinions, charts or any questions.

Inj Trade Plan📊 INJ Elliott Wave Update 🚀
Zigzag correction ✅ (5️⃣-3️⃣-5️⃣) followed by an ABC flat (3️⃣-3️⃣-5️⃣) — textbook cleanup before liftoff.
Wave (b) is in the past — Wave (c) just getting started 🟢
🔹 Wave 1 & 2 are complete
🔹 Wave 3 loading... ⚡
📍 Targeting:
• 1.618 @ $25.61 🎯
• 2.618 @ $142.12 💸
• 3.618 @ $193.99 🚀
🔻 Invalidation below $8.34 (78.6% retracement of wave 1)
🌊 If this count holds — we’re staring at a macro wave 3 explosion. Eyes on the prize. 🧠💥
#INJ #ElliottWave #CryptoTA #Altseason2025 #Wave3Incoming #LongSetup #InjMoonMission #TradingView

INJUSDTA breakout of the last lower low, a retest of resistance, and a rise above the breakout candle.
A 15% target at $15.

INJ Head & Shoulders patternINJ Analysis:
Injective (INJ) is nearing the completion of a right shoulder in a potential chart pattern, with a double bottom forming below, indicating a strong liquidity level. There’s also a high-probability demand zone right after that liquidity level, so i can expect that institucional buyers are looking for that levels for an entry to start the next big leg up.
Short term Sell idea with target ending in a Long term buying idea.
BTC Outlook & Altcoin Impact:
I expect Bitcoin (BTC) to climb to around $96,000 before its next major upward move. If this happens, it supports the idea that some altcoins, like INJ, may dip to capture untapped liquidity at lower levels before rallying.

Injective INJ price analysis🔼 We saw an infographic showing that the #Injective ecosystem currently ranks second in terms of capital inflow and retention. (First place goes to #Ethereum CRYPTOCAP:ETH with a threefold lead.)
🕯 Now let's check this information on the OKX:INJUSDT price chart, and we can see that there is indeed “buyer power”. After two months of growth, the price of #INJUSD is now adjusting quite moderately.
🍿 So, if #Injective is “preparing something really interesting” for the summer, then the price of their #INJ token should not fall below $10.
From there, it will be possible to organize “modest” growth, at least up to $27.
_____________________
Did you like our analysis? Leave a comment, like, and follow to get more


$INJ - Inverted head and shouldersCRYPTOCAP:INJ
BINANCE:INJUSDT.P
The price recently broke out from the inverted head and shoulders pattern; now, the price is going to retest the pattern's neckline.
If the price hits and bounces above the white line zone, or if the 4H candle hits and closes above the upper white line, it will be a good long opportunity.
TP: YELOW LINES
SL: 12.052 / 4H CC BELOW
NFA, DYOR
FOLLOW FOR MORE AND SHARE WITH YOUR COMMUNITY.
DON'T FORGET TO HIT THE BOOST BUTTON.

Injective & Elliott WavesAn impulse leads to a correction. A correction leads to an impulse.
The chart here starts with a bullish impulse. 1,2,3,4,5—blue-left. This impulse leads to a correction. ABC—orange.
The first ABC correction, the bear market, ends June 2022.
A correction leads to an impulse so a new bullish impulse starts right after and we have a new 5-up waves. 1,2,3,4,5—blue-center.
The bullish impulse ends March 2024 and this leads to a new ABC correction. Orange-right. The correction hits bottom 7-April 2025. The end of the correction signals the start of a new bullish impulse, 1,2,3,4,5 blue-right. The 2025 bull market.
This is Elliott Wave Theory simplified.
Namaste.

INJ long "@members
Leverage: 10x
Capital risk: <2-3%
Entry: market buy
Sl: 11.091
Tp1: 12.583 Tp2: 15.45
Looking for trend line break and Monthly open reclaim otherwise lower"
50EMA daily + MO low and PWL being reclaimed Tp1 already hit 12.6-13 area reversal if reclaimed likely full tp hit

$INJ will go Gersch ModeAbstract
This case study explores the use of multi-fib overlay systems to construct dynamic, predictive visual components for market analysis. By integrating fib retracements, trend-based extensions, fib channels, and fib circles, we generate a heat map of historical liquidity memory projected into future volatility zones. These overlapping structures reveal areas of liquidity convergence and gravitational compression — creating actionable forecasts for volatility implosion or expansion.
CRYPTOCAP:INJ provides a live demonstration of this methodology — showing how dynamic fib harmonics can map liquidity gravity wells and signal high-probability price attractors.
Technical Breakdown
Multi-fib harmonic convergence constructed from sequential macro pivots:
Local top to breakdown low,
Breakdown low to fake rally high,
Rally high to new cycle low,
New cycle low to local top.
Each fib retracement layer maps critical horizontal and diagonal liquidity zones — not in isolation, but as a system of overlapping attractors.
Dynamic Market Mapping -- Multi-Fib Overlay System
Full Fib Arsenal Deployed:
Fib Retracements — to identify historic price memory zones.
Trend-Based Fib Extensions — to project forward liquidity expansion corridors.
Fib Channels — to map volatility corridors and structural bias over time.
Fib Circles — to capture cyclical price oscillation and time-space compression arcs.
Each layer was color-arrayed, generating a dynamic heat map of historical inflection points projected into future price zones.
Zones of fib overlap dynamically reconstruct market memory — identifying gravitational attractor points where price is statistically drawn.
The denser the fib overlap, the greater the probability of price reaction — constructing a predictive liquidity gravity map centered around ~$1.34.
Compression Mechanics
Fib channels show visibly narrowing volatility bands — a classical signature of pre-move compression.
Diagonal trendlines drawn through fib anchors triangulate a singular convergence zone — the Gerschgorin singularity effect — concentrating liquidity, momentum, and structure collapse at a single focal point.
Market Structure Context
RSI reset and flatlining — energy stored, unreleased.
MACD curling under — momentum stalling.
ADX rising — latent pressure building beneath price action.
Volume profile thinning toward the lows — indicating a growing liquidity vacuum.
BTC dominance holding steady — suppressing altcoin volatility — ideal stealth compression conditions.
Scenario Analysis
Downward Compression (Base Case):
Volatility compression is expected to gravitationally pull CRYPTOCAP:INJ toward the fib convergence at ~$1.34 — signaling a potential final flush and preparation for long-term base formation.
Escape Velocity (Low Probability):
Should CRYPTOCAP:INJ break above internal fib channel resistance levels, invalidating the compression structure, an early reaccumulation and trend reversal may be in play — though historically, gravity dominates in setups of this kind.
Conclusion
Multi-fib overlay systems — when layered dynamically through retracements, extensions, channels, and circles — create a powerful visual map of market structure memory.
These dynamic visual trading systems expose the hidden gravitational forces within the market, allowing for high-probability forecasts of compression zones and volatility expansions.
CRYPTOCAP:INJ 's current structure — a textbook example of fib harmonic convergence and liquidity gravity mapping — demonstrates how past liquidity memory can predict future price behavior.
📉 Gravity wins more often than not.
No hopium — only structure, pressure, and inevitability.
#INJ #Injective #Crypto #DeFi #TechnicalAnalysis #LiquidityGravity #FibHarmonics #DynamicTradingSystems

INJ is stubborn but dump coming!Recently opened a short position on inj. It is surprisingly resilient given current market conditions with other alts losing support.
Inj is one of those alts on my watchlist for the week that i consider a high probability short according to my dtt setup as its quite high and at good levels to short yet so far tis been consolidating a bit.
I do think dump is coming though and it might break out of the consolidation more violently to catch up with rest of market.
Aiming for 10.665 but because the RR will be around 4 by time it returns to $11.1 I'll look to close out 60% of the position there.
Was able to get my stop around $12.589 at what I think is at good entry price around 12.286. Had entered a bit lower but close out position early and re-entered.
Time sensitive

Injective Easy 584% Bullish Wave Now PossibleInjective is now ready after a very long period of correction. The peak for this pair happened in March 2024 and in December 2024 there was no higher high, instead, a classic lower high and now a complete ABC correction. This ABC correction comes after a perfect, long-term, 1,2,3,4,5 bullish impulse.
After this correction ends will be the start of a new bullish impulse which will lead to a new All-Time High. The 584% target on the chart is an easy one. The 209% is super easy and can be approached by all types of market participants. This is a strong project.
There is really high volume as prices move to "baseline level." This is a support zone that was created after a long consolidation in 2023. Almost 7 months of consolidation. Sideways, and now this same range that worked as resistance is working as support. Support is confirmed because volume is rising, a very strong rise. INJUSDT is about to grow.
The entire Injective bullish wave, with a bottom in 2022 and a peak in 2024 amounted to 4,631% total growth. This is perfect and the market is ready now for a new round of growth.
Feel free to accumulate; buy and hold.
Namaste.

INJ at Key Compression Zone – Breakout Loading?Hello Traders,
CRYPTOCAP:INJ is currently trading between two key zones — a strong upper resistance and a solid lower support.
The price is getting squeezed between a descending resistance line and a rising support trendline, creating a high-confluence area.
So far, bulls are holding the support well. If price breaks above the upper zone, it could trigger a strong move upward.
However, if the support fails, a deeper correction may follow.
🔍 Watch closely — a breakout is brewing, and volatility is on the horizon.
DYOR, NFA

Inj End of week dump starts now!Just recently hopped into a short trade on inj.
Targeting 11.2 area.
The weekly candle currently is printing a bearish engulf with big top wick rejection and there is quite a lot of volume behind it.
30 min structure flipped back bullish at 4hr HH point. The very least I anticipate a new 4hr lower low confirmation around 11.78 - 4hr candle needs to close below that price to confirm the new LL. Am anticipating a more aggressive flush though, maybe within last 2hrs of the day.
THe analysis is done. All that is needed to do is nothing. Except monitor tp areas for potential early closure.

INJ – Rising Wedge in Play After 20% Surge🚀 INJ just pumped nearly 20% from our earlier entry zone — now forming a rising wedge on the 4H timeframe.
🔺 Price is grinding higher within the wedge structure — a breakout could extend momentum, but a breakdown would signal caution.
📊 Traders should watch for a clean move either way to gauge the next potential setup.
Are you riding this trend or waiting for confirmation?

#INJ/USDT#INJ
The price is moving within a descending channel on the 1-hour frame, adhering well to it, and is heading for a strong breakout and retest.
We are seeing a bounce from the lower boundary of the descending channel, which is support at 14.36.
We have a downtrend on the RSI indicator that is about to be broken and retested, supporting the upward trend.
We are looking for stability above the 100 Moving Average.
Entry price: 14.87
First target: 15.12
Second target: 15.57
Third target: 16.07

#INJ/USDT#INJ
The price is moving within a descending channel on the 1-hour frame, adhering well to it, and is heading towards a strong breakout and retest.
We are experiencing a rebound from the lower boundary of the descending channel, which is support at 12.60.
We are experiencing a downtrend on the RSI indicator that is about to be broken and retested, supporting the upward trend.
We are heading towards stability above the 100 Moving Average.
Entry price: 12.63
First target: 13.13
Second target: 13.60
Third target: 14.08

#INJUSDT ( cup & handle ? )For now, we can imagine a cup pattern for this currency that is building a handle.
The depth of the cup is also great..
The first condition for this pattern to be realized is to cross the first red arrow, which
opens the way to reach the second red arrow (the edge of the cup) and
Finally, crossing the edge of the cup can be great.

Injective Short-Term Inverse Head & Shoulders Bottom ReversalBITGET:INJUSDT successfully completed an IH&S Bottom Reversal pattern.
The measured target is $15.20, reinforced by the 200-day EMA.
If you missed the entry, watch the $10.80 neckline for a potential retest as support.
