Inj clean chartInj has very clean chart. It has taken upside liquidity that i have marked as x and then it did clear bos. Now main liquidity is below where i marked poi. This poi is goofd for long opening.
INJUSDT trade ideas

INJ Update: Take Profit AchievedThis is a video done to show the out ocme of the previous analysis done on INJ around March 23.

INJ/USDT - A Quick Trade#INJ/USDT #Analysis
Description
---------------------------------------------------------------
+ Price is at the current support level and i could see price retracing back to it's bullish trend
+ I'm expecting price to hit the its resistance level
+ I see a good long trade opportunity, i'm entering with 1% Risk
---------------------------------------------------------------
VectorAlgo Trade Details
------------------------------
Entry Price: 38.0
Stop Loss: 33.9
------------------------------
Target 1: 41.8
Target 2: 46.0
Target 3: 52.1
------------------------------
Timeframe: 4H
Capital Risk: 1-2% of trading capital
Leverage: 5-10x
---------------------------------------------------------------
Enhance, Trade, Grow
---------------------------------------------------------------
Feel free to share your thoughts and insights.
Don't forget to like and follow us for more trading ideas and discussions.
Best Regards,
VectorAlgo

INJ - Holding strong in support and expected to bounce backAs you can see in the chart, this is the 4th time INJ is bouncing back from support and showing a bullish sentiment. We can this trend to continue and the next target for INJ is around $70
Entry level: $ 28-32
Stop loss level $ 23
Target 1: $39
Target 2: $45
Target 3: $ 59
Target 4: $ 69
Max Leverage: 2x
Don't forget to keep stop loss.
Follow Our TradingView Account for More Technical Analysis Updates, | Like, Share and Comment Your thoughts.
Cheers
GreenCrypto

INJ - HigherLast night we added to our INJ position at $36.50, Here's why...
Looking at price action we had a symmetrical triangle the broke out of the pattern on Feb 12th and retested the pattern on Feb 23rd before having a 67% move to the upside. What we have noticed recently is how well the strong support from that pattern has continued to hold up price (green circles). The $30-$35 range has also be a strong accumulation zone that will be looked back on from the future.
Looking at our RSI we also see a pattern forming. We have a red trendline of downwards momentum and a green trendline of upwards momentum. Recently, we just bottomed again at our green trendline. Once, we break the red trendline we will go back to new highs.

INJUSDTINJUSDT is in strong bullish trend.
As the market is consistently printing new HHs and HLs.
currently the market is retracing a bit after last HH, which is 50% Fib retracement level and local support as well. if the market successfully sustain this bullish confluence the next leg high could go for new HH.
What you guys think of this idea?

INJ DISTRIBUTION Injective protocol after a big run seems to be in a distribution phase according to Wyckoff. I'm looking to long it again at 20$

INJ ready for another leg up
INJ has just broken the consolidation range of 3 months. Price now is just above the broken range and it seems that the retest is on-going.
For short-term trade, I bought at this price and look forward to selling at $74 and $99. Invalidation is when price falls back in the range (in 1D TF).
For long-term, Injective is a very promising L1 blockchain with a fast grow rate. I put in chart the list of L1 cryptos so that you can have a projection on the future position/market cap of INJ.
------ About INJ ----
Injective Protocol (INJ): A blockchain tailored for finance, facilitating DeFi applications like decentralized exchanges and lending protocols.
Unique Infrastructure: Features a fully decentralized MEV-resistant on-chain order book, supporting spot, perpetual, futures, and options markets.
Interoperability: Compatible with Ethereum, IBC-enabled blockchains, and non-EVM chains such as Solana, offering cross-chain bridging capabilities.
Advanced Smart Contract Platform: Utilizes CosmWasm for smart contract execution, enabling multi-chain transactions and automatic contract execution.
Growing Ecosystem: Supported by prominent investors like Binance and Pantera Capital, with a global community exceeding 150,000 members, fostering innovation in decentralized finance.
Disclaimer:
This analysis is based on my personnal views and is not a financial advice. Risk is under your control.

$INJ #Injective Trading IdeaINJ/USD (Injective) price increased after breaking the first consolidation channel, then the second one, but on the third, we saw a small pump and the price went back inside the channel (fakeout). The money flow is going down and there is a probability of seeing a move to the downside.

INJ pullback soon INJ over 900% without corrections. I think soon we will see health pullback BINANCE:INJUSDT
Possible Targets and explanation idea
➡️Market Mood indicator we are at Sep 2021 level sentiment. Late longs will be liquidated
➡️0.5 - 0.62 lvls fib can be a fix profit zone before correction
➡️Inside this zone we got liquidity stop losses from September 2021
➡️Based Money power indicator whales start take a profit
➡️Healthy correction can be even to 5-6$ My previous idea 2.5 Monthly fvg probably invalidated for this current moment but will be like a main zone for next bear market
Hope you enjoyed the content I created, You can support with your likes and comments this idea so more people can watch!
✅Disclaimer: Please be aware of the risks involved in trading. This idea was made for educational purposes only not for financial Investment Purposes.
---
• Look at my ideas about interesting altcoins in the related section down below ↓
• For more ideas please hit "Like" and "Follow"!

INJ/USDT Gearing up for a Bullish Momentum Again? 👀INJ Analysis💎Heads up, Paradisers! #INJUSDT is on the brink of a bullish turnaround from a crucial support level at $30.12. If CRYPTOCAP:INJ maintains its momentum here, there's a high chance for a bullish journey, given the price's historical reverence for this support, marking it as a stronghold after respecting it three times.
💎However, if the upward trajectory of #INJ falters and dips below $30.12, we'll turn our attention to a lower demand zone at $16.62, where ample liquidity promises a potential rebound.
💎Vigilance is paramount: a breach below this secondary support could spell further declines as market sentiment leans toward a sell-off. Stay alert, traders, as we navigate the shifting currents of the #Injective market.

INJUSDT short POTENTIALOf cause crypto market is bullish and INJ is still looking good for long but not at current point in the way i see the market!!!
Idea will be valid for me till daily low taken out. I would like to see another push back into original consolidation to look into position on LTF.
I dont set targets for me here first of all because i will be managing position according to my trading strategy and secondly there was no entry for me :)))

Inj/usdt#INJ
update on 1D
Look at the this analiz
Inj first go to big support then step go to the 106$

inj on sk systembullish inj on sk-system with target 74-83$
based on fibonacci higher low and higher high

risky entry point 15M timeframei think its a risky entry point. the price could bounce up. 4% with 2x Leverage
do your own research. its risky i 15M time frame

buy signalhello
as you see in indicator bellow that i believe +70% of times works.
so as i mentioned in 1D chart the price is going up.
i see the indicator showed overbought in 4D chart that i marked with a box then the price went down. so the indicator bounced back with green bars so i will buy to top of the indicator.
i see the price at 51.6 zone. 20% from 45.5 easily with 2x leverage


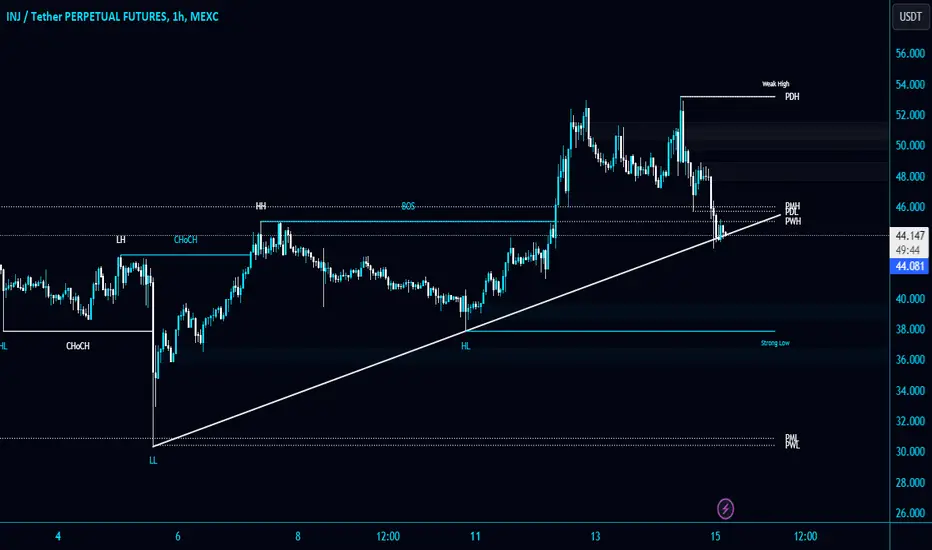
#INJ/USDT is testing the Diagonal Trendline in 1-Hour TF!#INJ/USDT is testing the Diagonal Trendline in 1-Hour TF!
CRYPTOCAP:INJ breaks the PWH $45 support level and looks heavy to me. #INJUSDT is looking good for short.
Wait for Trendline breakdown and retest to short it.
inj inteligentassetBullish scenario
Resistances 52.7 pivot high,64 Fibonacci extension
Bearish scenario
Supports 42.1 upper limit channel, 39 in 50 ema, 29.4 pivot low & horizontal,
27.15 in 200 ema

INJ may aiming for higher.INJ has been broken out from its consolidation range. The price action above consolidation range suggested that it may aiming for higher target, 95.

Would a cup and handle pattern appear on INJ/USDT chart?If a cup and handle pattern gets formed on INJ/USDT chart, we will have a good chance to long.
I am not saying the pattern will appear, just saying if it appears, we will have one position entry point.

INJ USDT for 200%Hello traders, my idea for INJ is that if the price can stay above Bridge W, the price will likely go up 61-100% of M1 and it might take 1-2 months if bitcoin is still bullish. The price target we set. It's not difficult.
TP1 60
TP2 71
TP3 90

INJ Time Coming 👉 It’s Almost Three Months That INJ Price Playing At The 45$ to 30$ Range At This Horizontal Channel But I Think It’s Time To Breakout
📥 I Expect a The Price Break The 45K Resistance Level By Strong Green Candle Toward a 55$ And 70$ As a Next Targets Soon
