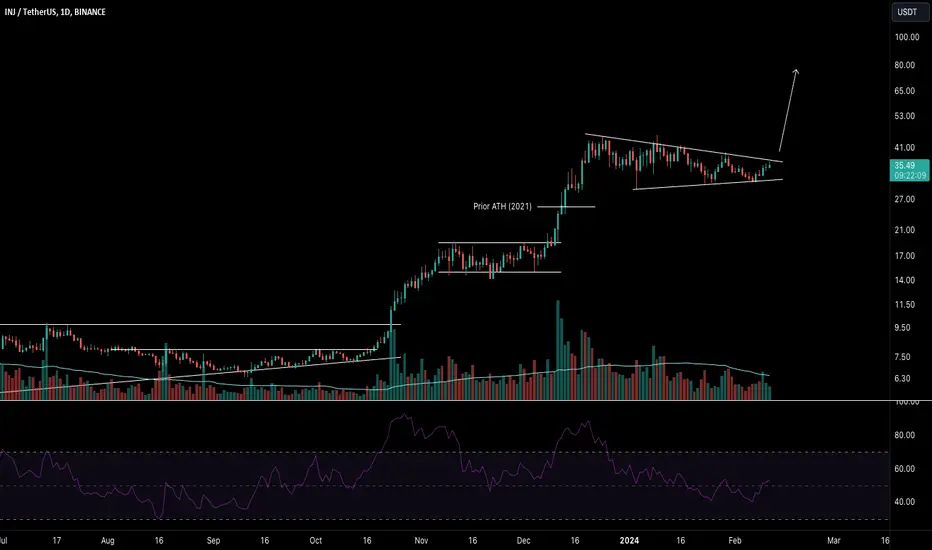
INJ Long opportunityInjective looks ready to pump in the next days. We can see that it has broken out from low-term trend, and it's actually in a good accumulation phase. I expect the price to pump soon and it can reach mod-term resistance at 41/42
INJUSDT trade ideas

$INJ Is Ready Price has been consolidating Since Mid December 23' once we sweep current lows I expect major expansion to the upside to continue the bullish momentum

Inj Usdt Daily Chart AnalysisInj Usdt Daily Chart Analysis
40$ First Target Stay Patient
Cheers Boost

Support-turned-Resistance Structure with Bullish MACD DivergenceSupport-turned-Resistance Structure with Bullish MACD Divergence and Volume Profile Analysis
Summary:
This trade proposal focuses on identifying a support-turned-resistance structure around the 33.75 level in Injusdt. Previous resistance turned support, combined with a bullish MACD divergence, suggests a potential buying opportunity. Utilizing Volume Profile analysis, we aim to determine profit-taking levels near the upper boundary of the 70% volume area.
Technical Analysis:
Support-turned-Resistance Structure: The 33.75 level has previously acted as both resistance and support, demonstrating its significance in the price action of Injusdt. After being breached twice, it now serves as support, indicating a potential shift in market sentiment.
Bullish MACD Divergence: A bullish divergence has been observed in the MACD indicator, where the price forms lower lows while the MACD forms higher lows. This discrepancy suggests weakening bearish momentum and a potential reversal to the upside.
Interpretation:
The confluence of the support-turned-resistance structure at 33.75 and the bullish MACD divergence provides a compelling case for a bullish trade. By utilizing Volume Profile analysis, we aim to identify profit-taking levels near the upper boundary of the 70% volume area, where significant selling pressure may emerge.
Trade Plan:
Entry: Consider entering a long position once the price rebounds from the 33.75 support level, confirming its role as support. Alternatively, wait for a bullish candlestick pattern or a break above a key resistance level to confirm upward momentum.
Stop-Loss: Place a stop-loss order below the 33.75 support level to protect against potential downside risks. Adjust the stop-loss level based on the volatility of the asset and your risk tolerance.
Take-Profit Target: Utilize Volume Profile analysis to identify the upper boundary of the 70% volume area as a potential profit-taking level. This level may act as a significant resistance zone where selling pressure could increase, leading to a potential reversal or consolidation.
Risk Management:
Manage risk by sizing positions appropriately and adhering to proper risk-reward ratios. Monitor the trade closely and consider adjusting the stop-loss and take-profit levels as the trade progresses.
Disclaimer:
Trading carries inherent risks, and there is no guarantee of profits. Conduct thorough analysis and consider all factors before making trading decisions. Utilize stop-loss orders and risk management strategies to mitigate potential losses.

Inj Usdt Daily Chart AnalsysisInj Usdt Daily Chart Analsysis
Chart is Clear we are safe until above trendline small pullbacks are apart of game best time to enter again now
Cheers Boost my signals follow

INJ massive weekly wedgeINJ, my largest holding is forming a huge contraction area forming a wedge on the weekly. Long term consolidation here is very bullish. A reset of the stochastic RSI is also noted. I expect an upward expansion here with the bullish market we have. If you have been sidelined this could be a great entry zone for a long-term position.

BUY Zone for INJINJ has a bullish run at the start, and is consolidating and forming a penant.. Buy zone is mentioned on Chart.
INJ is the most bullish project this season.

$INJ today.. not my pair but someone asked ...Hello,
INJ won't be able to close above it's .618 fibo, going down for today (at least 2 next 4 hr candles)
TP1 33.5 TP2 33, for more, need more candles and check BTC movements ;)
Enjoy

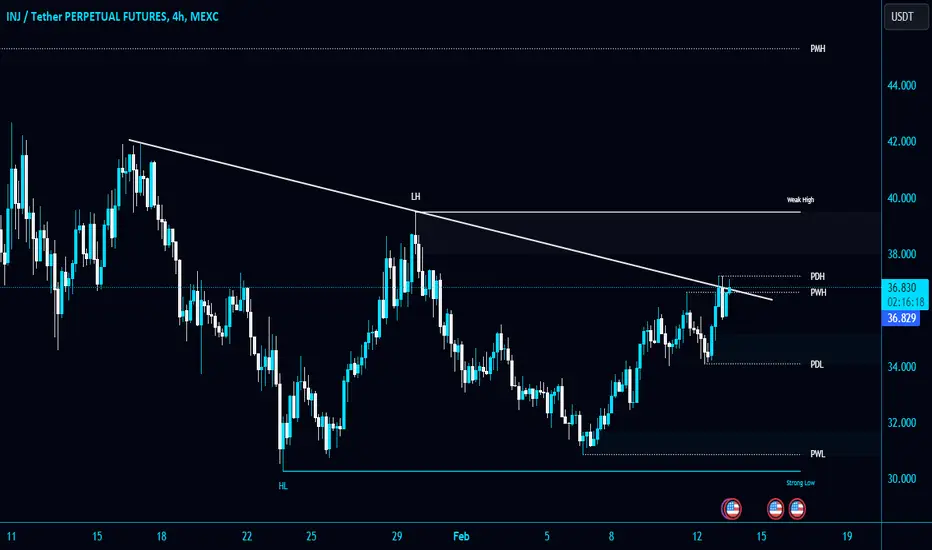
#INJ/USDT is trying to break the Diagonal trendline in 4-Hour TF#INJ/USDT is trying to break the Diagonal trendline in 4-Hour TF!
CRYPTOCAP:INJ needs to clear the Trendline to gain the bullish momentum. #INJUSDT local resistance level is PDH $37.21 level and local support level is PDL $34.12.
INJ Bullflag updatedINJ still hasn't broken out of this bullflag...
but when it does...where do we think it's going???


Injective in the verge of breakout from the triangle. After a couple of weeks consolidation Injective has completed 4th corrective wave in the triangle. Breakout above triangle gives confirmation for a price action target at the minimum level of 50.Triangle breakout of 4 th wave should provide a huge thrust in the price action for Injective.

INJ USDT DAILY CHART ANALYSISINJ USDT DAILY CHART ANALYSIS
Evert thing is clear in chart
cheers & boost my calls thanks in advance keep touch

INJUSDT is looking bearish INJUSDT is looking bearish right now after it has rejected the downtrend resistance line and made new LL, so I expect the price to drop back to 31$.

✴️ Injective Next Target ~22/20 (Short-Term Prediction)As soon as I looked at this chart, I started seeing myself explaining to you all of the chart signals, I sounded condescending in my mind... I was like, "Oh no, this is definitely not the goal..." and I felt ashamed.
So instead of reading the signals I will just give you the next target.
On the 3rd of January INJUSDT hit 27 testing EMA50 as support.
The next moving average we track after EMA50 is EMA100, which would be the next logical resting point but here is the thing, EMA100 is now within the price range of EMA50 as it was a little more than a month ago. This means that on a drop this level will be ignored since we have a lower high we should aim for a lower low.
Long story short: The next target sits around EMA200 (purple) or 22, with 20 possible on a wick. This is based on the moving averages and Fibs.
We can call this a short-term prediction, now we wait and see.
Thank you for reading.
It is truly my pleasure to have you today, here with me.
I hope to see you again in the future, more and more... I am truly grateful for your continued support.
Namaste.

INJ ANALYSIS🔮 #INJ Analysis - Breakout Trading 💰💰
🌟🚀 #INJ is trading in a Bullish Flag Pattern in 8h time frame. We can expect a long rally in #INJ after breakout.💲💲
🔖 Current Price: $35.56
⏳️ Target Price: $47.12
⁉️ What to do?
- We have marked crucial levels in the chart . We can trade according to the chart and make some profits. 🚀💸
🏷Remember, the crypto market is dynamic in nature and changes rapidly, so always use stop loss and take proper knowledge before investments.
#INJ #Cryptocurrency #DYOR

Blow Off Top IncomingINJ getting very tight and looks ready to attempt a breakout. If so, this would be the 5th wave of this major leg. PT = $100
INJ NEW UPDATEOn the chart, from where we entered "START", we seem to see a correction.
This correction seems to be a diametric.
There was a suitable place for the termination of the D wave on the chart, which we marked with red color.
If the price reaches this range, you can enter a sell/short position.
We have specified the targets on the chart.
For risk management, please don't forget stop loss and capital management
When we reach the first target, save some profit and then change the stop to entry
Comment if you have any questions
Thank You

inj breaking out already on uptrend and finally breaking another bullish continuation pattern expecting massive bullish rally in coming days
breaking bullish flag and expecting successful breakout successful breakout can lead another solid move towards 50 to 55$
keep eyes on injective for confirmed breakout

INJ - Is the Bull Rally Over?📉Hi Traders, Investors and Speculators of Charts📈
With this chart, we aim to identify the current phase of INJ by using the Wyckoff Method . The Wyckoff Method can be extremely technical and complicated, with many phases, sub-phases, sub sub phases etc. The four main phases of the market cycle are accumulation, markup, distribution, and markdown. On this specific chart, we're taking a look at what comes next after the big bullrun is completed.
Furthermore, a brief look at the phases:
Start of the Bullish Cycle:
The price start increasing rapidly, often making parabolic increases. Pullbacks are short-lived, and the rally continues afterwards.
PEAK:
This is the clear ATH that is established by the bullish cycle. This is where the buyers run out and the tables turn to where sellers start to dominate for the upcoming bearish phase.
Failed Rally:
The buyers try one more time to push past the previous high, but fail. Instead, a lower high is made and is usually marked by a bearish pattern or double top candlestick.
Accumulation Phase:
This is usually considered the boring zone. This is where price trades range for a long period of time, whilst whales bulk up for the bullish cycle to come next.
All of the above in mind, I believe we are currently trading towards the failed rally phase. This means that we may still test support zone / resistance zone multiple times, until either the bears or the bulls take charge.
If you found this content helpful, please remember to hit like and subscribe and never miss a moment in the markets.
_______________________
📢Follow us here on TradingView for daily updates📢
👍Hit like & Follow 👍
CryptoCheck
BINANCE:INJUSDT

🚧INJUSDT will Go Up Again🚧 Road Map(6-H)🗺️!!!Hi .
-Due to the ascending structure of the chart
- High potential areas are clear in the chart
- You can look for reasons to enter according to your own personal strategy after approval.
CRYPTOCAP:INJ has support levels at $29 and $24 which are good areas to place buy orders 📝
_ _ _ _ _ _ _ _ _ _ _ _ _ _ _ _ _ _ _ _ _ _ _ _ _ _ _ _ _ _ _ _ _
✅ Thank you and for more ideas ❤️ like ❤️ and 🌟 follow 🌟!
⚠️Things can change...
The markets are always changing and even with all these signals, the market changes tend to be strong and fast!!

INJUSDT.4HBased on the provided market data, INJ is currently trading at $34.49 with a 4-hour RSI (Relative Strength Index) of 55.63, which is a neutral territory. The 4-hour MACD (Moving Average Convergence Divergence) is positive at 0.63, indicating an upward momentum. However, it's slightly below the 4-hour Bollinger Band midpoint of 36.26. The immediate supports on the 4-hour chart are at $33.90, $31.80, and $30.20, while the resistances are at $36.41, $38.30, and $39.60.
On the daily chart, INJ has a neutral RSI of 50.51 and a negative MACD of -0.66, suggesting a lack of clear direction. The immediate supports are at $33.80, $30.77, and $29.20, and resistances at $39.40, $41.90, and $43.90.
The 7-day data shows a high RSI of 70.22, indicating the crypto is overbought, and a MACD of 7.35, suggesting bullishness. The supports are at $23.10, $17.60, and a notably low $5.16, while the resistances are at $45.30, $52.10, and $60.30.
In conclusion, INJ shows mixed signals on different time frames. While the short-term (4-hour) and long-term (7-day) data indicate bullishness, the daily data suggests a lack of clear direction. Traders should monitor the market closely and consider these levels while making decisions. It's always recommended to incorporate other market factors and risk management techniques in trading decisions.

INJ/USDT Looking BullishTRADE ALERT!INJ
Ticker: INJ/USDT
Entry: 34$ - 35$
Take Profit: 40-43$
Stop Loss: 30.94$
Risk to reward: 1:2
Technical Thesis: INJ inside a symmetrical traingle about to breakout, if this happen we can open a long position. Keep an eye on it
