USD/INR pullback possible, USD/MXN eyes 18.95 USD/INR surged from 86.30 to nearly 87.85 in just over a week, driven by U.S. President Donald Trump announcing plans to impose a 25% tariff on select Indian exports.
The latest 4H candles show signs of exhaustion, with price stalling near the highs and forming small-bodied candles with upper wic
Related currencies

USDINR - Reposting 1st May Chart for Study purposeDate: 26-05-2025
#USDINR - Reposting 1st May Chart for Study purpose and to see how the levels are behaving between the resistance and support. We should also note that the movement was between downside target 1 and upside target 1 (86.10) with precision.
The old levels remain the same and the le

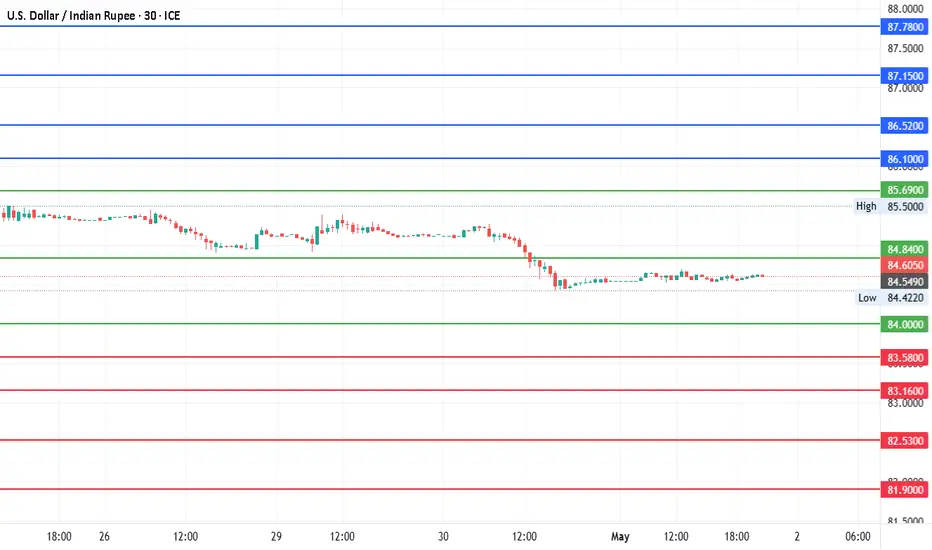
USDINR - Ready for 2.5 points moveCurrent Price: 84.6050
Upside: 86.10, 86.52, 87.15 and 87.78
Downside: 83.58, 83.16, 82.53 and 81.90
Green lines represent the support and resistance levels.
USD / INR - 2025 & 2026 will decide the path3M candle (Q1 2025) printed a bearish signal with a top at $88.
Structure looks weak for now, a break below this candle could confirm a bearish shift.
DXY is cooling off due to a dovish Fed outlook, easing inflation, and broader macro rotation into risk assets. If the 100–102 zone breaks, expect ex

USDINR looks good at this levelsA close above 86.35 can go upto 88.35 levels in short term about a week or so with a stoploss of 84.90 levels.
Chart showing some strength #usdinr

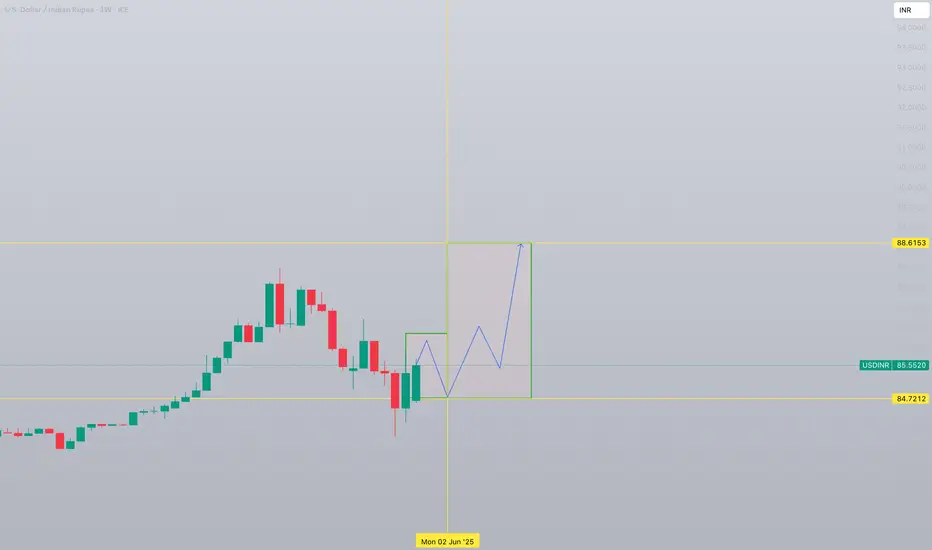
USD/INR 1W forecast until August 2025US Dollar has shown bottom and formed a reversal formation. Current growth will not last long and will find its top at 86.1487 with possible slight overshoot in the second half of May 2025.
This will be followed by second bottoming at 84.7212 in the beginning of June 2025.
Double bottom formation wi
INR has made a major top against USDFall of INR against the USD began in early 1970s, or perhaps late 1960s--we don't know for sure for lack of trading data. Since then, it has depreciated against the USD in crystal-clear 5 legs, or waves according to Elliott Wave Theory (EWT). To validate EWT, there occurred a gigantic gap of 9.23% i

USDINR + LuxAlgo Sequencer + GAN SQ 9 + CANDLES The LuxAlgo Sequencer is a indicator that is able to highlight sequences of prices based on their relative position to past prices.
The red counts reaching to no 9 with a small red arrow pointing down is marked with a line which is the Bearish Preparation Phase . It indicates chances of the prices

USDINR dropped below the 50 EMA, the first Time Since Oct,2024 😊 USDINR for the first time since October 2024, price has dropped below the 50 EMA , signaling potential weakness.😊
Watching price action closely! 📉

Indian market cannot go bullish until RUPEE becomes strong !a lot of analysts saying Dollar is going to week vs rupees but seeing technical chart, dollar is traded above 50 EMA and never come to touch since October. currently Dollar completed Symmetrical Pattern showing any upcoming momentum may happen, either bullish or bearish is just could say after seein

See all ideas
Summarizing what the indicators are suggesting.
Oscillators
Neutral
SellBuy
Strong sellStrong buy
Strong sellSellNeutralBuyStrong buy
Oscillators
Neutral
SellBuy
Strong sellStrong buy
Strong sellSellNeutralBuyStrong buy
Summary
Neutral
SellBuy
Strong sellStrong buy
Strong sellSellNeutralBuyStrong buy
Summary
Neutral
SellBuy
Strong sellStrong buy
Strong sellSellNeutralBuyStrong buy
Summary
Neutral
SellBuy
Strong sellStrong buy
Strong sellSellNeutralBuyStrong buy
Moving Averages
Neutral
SellBuy
Strong sellStrong buy
Strong sellSellNeutralBuyStrong buy
Moving Averages
Neutral
SellBuy
Strong sellStrong buy
Strong sellSellNeutralBuyStrong buy
Displays a symbol's price movements over previous years to identify recurring trends.
Frequently Asked Questions
The current rate of INRUSD is 0.01140 USD — it has decreased by −0.31% in the past 24 hours. See more of INRUSD rate dynamics on the detailed chart.
The value of the INRUSD pair is quoted as 1 INR per x USD. For example, if the pair is trading at 1.50, it means it takes 1.5 USD to buy 1 INR.
The term volatility describes the risk related to the changes in an asset's value. INRUSD has the volatility rating of 0.31%. Track all currencies' changes with our live Forex Heatmap and prepare for markets volatility.
The INRUSD showed a −0.20% fall over the past week, the month change is a −2.22% fall, and over the last year it has decreased by −4.17%. Track live rate changes on the INRUSD chart.
Learn how you can make money on rate changes in numerous trading ideas created by our community.
Learn how you can make money on rate changes in numerous trading ideas created by our community.
Currencies are usually traded through forex brokers — choose the one that suits your needs and go ahead. You can trade INRUSD right from TradingView charts — just log in to you broker account. Check out the list of our integrated brokers and find the best one for your needs and strategy.
When deciding to buy or sell currency one should keep in mind many factors including current geopolitical situation, interest rates, and other. But before plunging into a deep research, you can start with INRUSD technical analysis. The technical rating for the pair is sell today, but don't forget that markets can be very unstable, so don't stop here. According to our 1 week rating the INRUSD shows the strong sell signal, and 1 month rating is strong sell. See more of INRUSD technicals for a more comprehensive analysis.