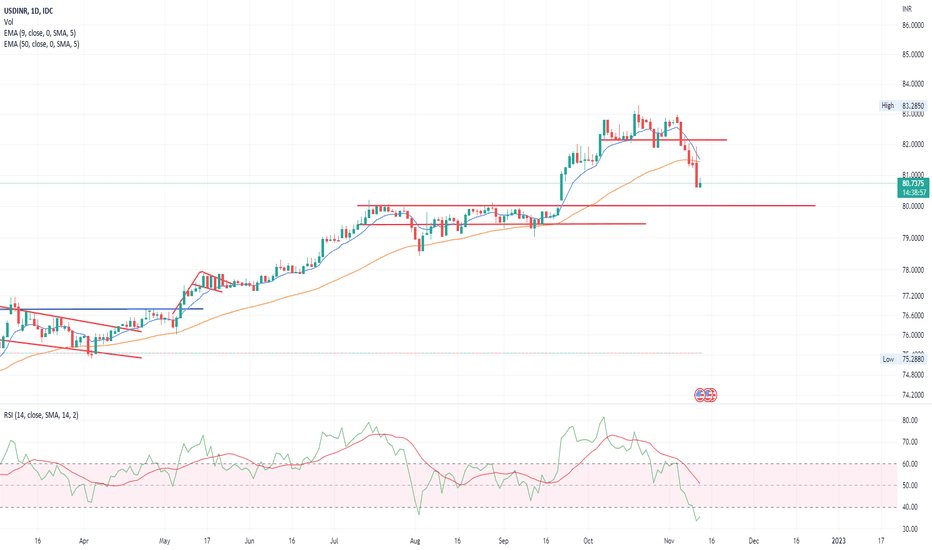
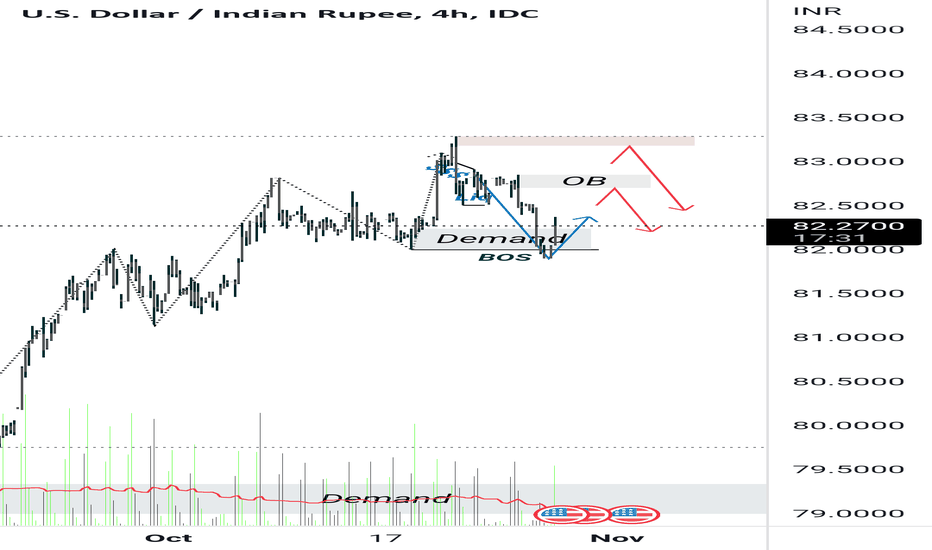
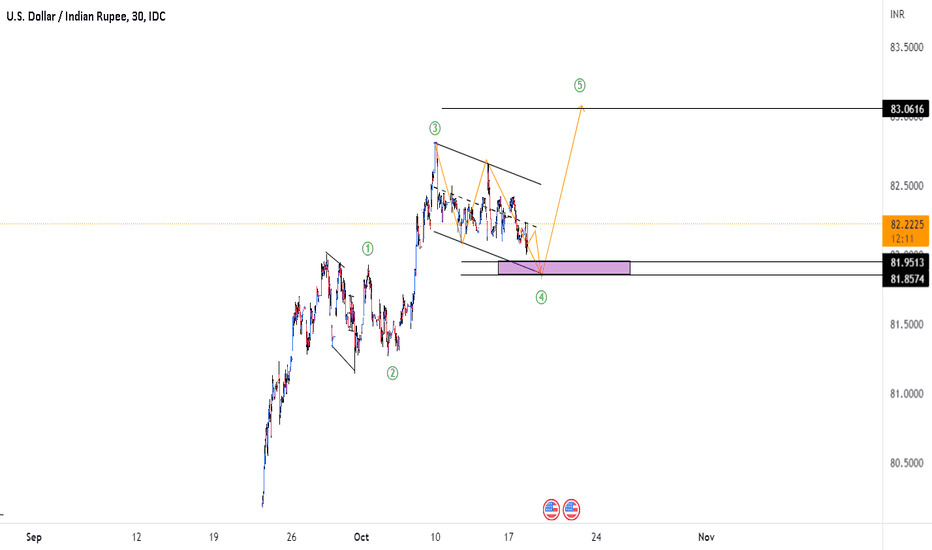
USDINR stuck in range and waiting for a breakoutUSDINR is stuck in a range for last few weeks. Both price and RSI are oscillating in a narrow range. This price action would lead to sharp one-sided move on a successful breakout.
On downside, the target is around 81.90 and on the upside the target is around 83.30
INRUSD trade ideas
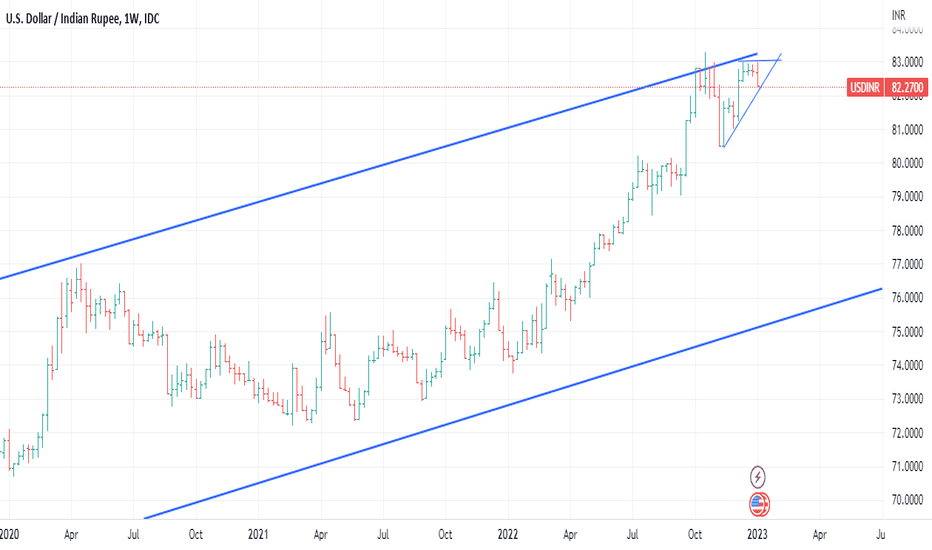
USDINR- Weekly Outlook-Venkat's BlogThe pair finally broke the narrow range of 81.55-82.92 during last week. As expected possibilities of decent supply or lack of aggressive buying has resulted in the prices easing toward 82.30 which is another crucial level being the trend line support. Only a daily close below 82.30 would suggest further correction towards 81.90. Deeper corrections cannot be expected till we see a close below 82.10. Most likely scenario would be a consolidation between 81.90 and 83.70. A close outside this range requires re-assessment of risk/direction and target.
A few more observations:
narrow range broken
We may not see a runaway in DXY. There can be relief rallies.
Though the DXY attempted cross over of 105+, it got hammered
Any spike in DXY need not necessarily impact this pair
The raising upward channel indicate the broader range of 80.10-83.10
The increased volatility and wild swings likely to continue
Disclaimer: The views expressed here are personal and not connected to SYFX Treasury Foundation. The views are for learning and reference purpose only.
USDINR- Weekly Outlook-Venkat's BlogThe pair moved in a range of 81.55-82.92 during last week. The top at 82.96 remains same for the past 2 weeks there by making this a Tweezer top. There are chances that there could be stronger supply coming in at close to 82.95 and that the fresh flows could make the pair drift towards 82.44 and then to 82.10 support. Only a daily close below this would suggest further correction towards 81.90. Deeper corrections cannot be expected till we see a close below 82.10. Most likely scenario would be a consolidation between 82.20 and 83.20. A close outside this range requires re-assessment of risk/direction and target.
A few more observations:
The pair has a characteristic of moving in a very narrow range and suddenly moves taking everyone by surprise
We may not see a runaway in DXY. There can be relief rallies.
Full impact of the correction has not yet been seen in USDINR currency pair. Hence, the spikes in DXY need not necessarily impact this pair
The raising upward channel indicate the broader range of 80.10-83.10
The increased volatility and wild swings likely to continue
Disclaimer: The views expressed here are personal and not connected to SYFX Treasury Foundation. The views are for learning and reference purpose only.
USDINR-Weekly Views
The pair moved in a range of 81.57-82.96 during last week. The pair continues to move towards the crucial resistance at 83.10-83.30 zone. Though the pair has maintained a higher lows the top at 83.96 remains same for the past 2 weeks there by making this a Tweezer top. There are chances that there could be stronger supply coming in at close to 82.95 and that the month end flows could make the pair drift towards 83.44 support. Only a daily close below this would suggest further correction towards 81.90. Till then we may see one more week of narrow range of 83.10-82.40. While the monthly candle is still in progress, it appears that the pair may make one more attempt of the trend line resistance at 83.30. Deeper corrections cannot be expected till we see a close below 81.20. Most likely scenario would be a consolidation between 82.20 and 83.20. A close outside this range requires re-assessment of risk/direction and target.
A few more observations:
The long term trend line till at 83.10-83.30 levels holds for now and we are likely to see a consolidation between 79-82
We may not see a runaway in DXY. There can be relief rallies.
Full impact of the correction has not yet been seen in USDINR currency pair. Hence, the spikes in DXY need not necessarily impact this pair
The raising upward channel indicate the broader range of 80.10-83.10
The increased volatility and wild swings likely to continue
Seasons Greetings and Best wishes for a Happy New Year 2023
Disclaimer: The views expressed here are personal and not connected to SYFX Treasury Foundation. The views are for learning and reference purpose only.
USDINR-Currency ViewThe pair moved in a range of 81.20-82.76 during last week. Break above 81.80 which held for three weeks triggered sudden spike to next resistance at 82.75. While the monthly candle is still in progress, it appears that the pair may make one more attempt of the trend line resistance at 83.30. Deeper corrections cannot be expected till we see a close below 81.20. We can expect supply around the closer resistance at 81.80. We are witnessing demand driven by lower crude and outstanding unhedged exposure getting covered. Most likely scenario would be a consolidation between 81.20 and 83.20. A close outside this range requires re-assessment of risk/direction and target.
A few more observations:
The long term trend line till at 83.10-83.30 levels holds for now and we are likely to see a consolidation between 79-82
We may not see a runaway in DXY. The 105-106 range is yet another crucial price point and we may see further fall to 102.
The full impact of the correction has not yet been seen in USDINR currency pair
The raising upward channel indicate the broader range of 80.10-82.70
The increased volatility and wild swings likely to continue
Disclaimer: The views expressed here are personal and not connected to SYFX Treasury Foundation. The views are for learning and reference purpose only.
Indian Rupee bears need validation from 82.65- USD/INR picks up bids to reverse the previous day’s pullback from monthly high.
- Seven-week-old descending trend line, bearish MACD signals tease sellers.
- Sustained trading beyond 200-SMA keeps buyers hopeful of witnessing fresh record top.
USD/INR remains firmer around a one-month high as it jostles with a short-term key resistance line near 82.65 during early Thursday.
The Indian Rupee (INR) pair rose to the highest levels in a month the previous day before reversing from 82.77. In doing so, the USD/INR pair retreated from a downward-sloping resistance line from October 19 following the Reserve Bank of India’s (RBI) interest rate hike.
It’s worth noting that the failure to cross the aforementioned resistance line joins the recently bearish MACD signals to tease USD/INR sellers.
However, successful trading beyond the 200-SMA level, around 81.80 by the press time, keeps the pair buyers hopeful.
As a result, the quote is likely to remain firmer but the further upside needs validation from the previously mentioned resistance line near 82.65.
Following that, a run-up towards the all-time high marked in October around 83.45 can’t be ruled out.
Meanwhile, a downside break of the 200-SMA could welcome the USD/INR bears. That said, the late November swing high around the 82.00 round figure also restricts short-term declines of the pair.
USDINR-Currency View The pair moved in a range of 81.00-81.83 during last week. However, the Monthly candle confirms the trend reversal. We can safely assume that the top at 83.10-83.30 is expected to hold for the current month and possibly till the year end. The closer resistance at 81.80 itself is likely to see good amount of supply. We are witnessing demand driven by lower crude and outstanding unhedged exposure getting covered. The ultimate projection for the down move is 79.20 which might take a couple of weeks. The indications are that the currency is expected to consolidate between 80.70 & 82.70. A close outside this range requires re-assessment of risk/direction and target.
A few more observations:
In the previous blogs the comparative analysis of 2018 & current scenario was discussed and suggested a possible correction in Nov 22 which is in progress. We saw nearly a 4 big figure correction in 2018. If the same were to repeat, we may see 79.20 soon.
The long term trend line till at 83.10-83.30 levels holds for now and we are likely to see a consolidation between 79-82
We may not see a runaway in DXY. The 105-106 range is yet another crucial price point and we may see further fall to 102.
The full impact of the correction has not yet been seen in USDINR currency pair
Slow paced correction is a cause of concern as we have seen sudden sharp moves after a long periods of still/stale moves
The raising upward channel indicate the broader range of 80.10-82.70
The increased volatility and wild swings likely to continue
Disclaimer: The views expressed here are personal and not connected to SYFX Treasury Foundation. The views are for learning and reference purpose only.
USDINR weekly short predictionThe points outlined in the chart suggest a bearish outcome over the next several candles. The target is approximated by extrapolating the Cosmic Gravity resistance channel bottom and the stop is set a its extrapolated top. However as stated in the chart's blue (bullish) bubble, if the price breaks above the resistance channel it will necessitate a reassessment of the signals.
Currency Views-USDINRAfter a sharp recovery in the previous week the pair was traded in a narrow range of 81.44-81.93 during last week. However, the Monthly candle confirms the trend reversal. We can safely assume that the top at 83.10-83.30 is expected to hold for the current month and possibly till the year end. We are witnessing demand driven by unhedged exposure getting covered. The ultimate projection for the down move is 79.20 which might take a couple of weeks. Due to various factors the currency is expected to consolidate between 80.70 & 82.70. A close outside this range requires re-assessment of risk/direction and target.
A few more observations:
• In the previous blogs the comparative analysis of 2018 & current scenario was discussed and suggested a possible correction in Nov 22 which is in progress. We saw nearly a 4 big figure correction in 2018. If the same were to repeat, we may see 79.20 soon.
• The long term trend line till at 83.10-83.30 levels holds for now and we are likely to see a consolidation between 79-82
• The DXY breaking the strong 106 is a sign of top in place for USD index. We may not see a runaway in DXY. the 105-106 range is yet another crucial price point and breach would see further fall to 102.
• The full impact of the correction has not yet been seen in USDINR currency pair, the fall in DXY might have given a sigh of relief for many Central Banks
• We do not see an immediate threat of crossing 83
• The raising upward channel indicate the broader range of 80.10-82.70
• The increased volatility and wild swings likely to continue
USDINR (U.S.Dollar / Indian Rupee) Currency Analysis 29/03/2021on a bullish impulsive wave we can see there exist a Hidden Bullish Divergence with MACD which is the sign of trend Continuation, followed by a Milled Bullish Divergence
there total of 2 Targets Defined by Fibonacci projection,
79.50 Rs seem to be a good target for the end of 2021
USDINR - LongUSDINR - My bet will be in Long side for a target of 84 in 3-4 months positional trade. In short term it will be having strong resistance at 82.4 and will consolidate for few days.
Currently it is making flag pattern on daily chart with high probability of going higher in few trading sessions.
USDINR Bullish Trend - Target 80-81 by Aug 2022USDINR has been in bullish upwards trend channel for last 4-5 years and has been consolidating sideways since Mar 2020. If it manages to close above 76 in next 2-3 months, it will be big breakout and soon we can expect it to reach 80-81 by Aug 2022 or earlier. Globally all countries are printing money and weakening the currencies and with all uncertainty around COVID and global economy, Dollar seems to be a better hedge. Most currencies will lose value against US Dollar and USD will lose against Gold.
USDINR Short 2HRTF based on 3 simle indicatorsIndicators:
200EMA
Bollinger bands
RSI
Trade conviction:
RSI Daily TF strength is declining
Dear traders, I have identified chart levels based on my analysis,
major support & resistance levels. Information shared by me here for educational
purpose only. Please don’t trust me or anyone for trading/investment
purpose as it may lead to financial losses. Focus on learning,
how to fish, trust on your own trading skills and please do consult your
financial advisor before trading.
Please do review, analyse and share your comments as well.
Let us work and win together. Wish you a very happy, healthy & profitable trading day ahead!
Disclaimer: I have analysed the data based on my limited knowledge.
Please don’t trust me for trading as it may lead to financial losses.
Please consult your financial advisor before trading
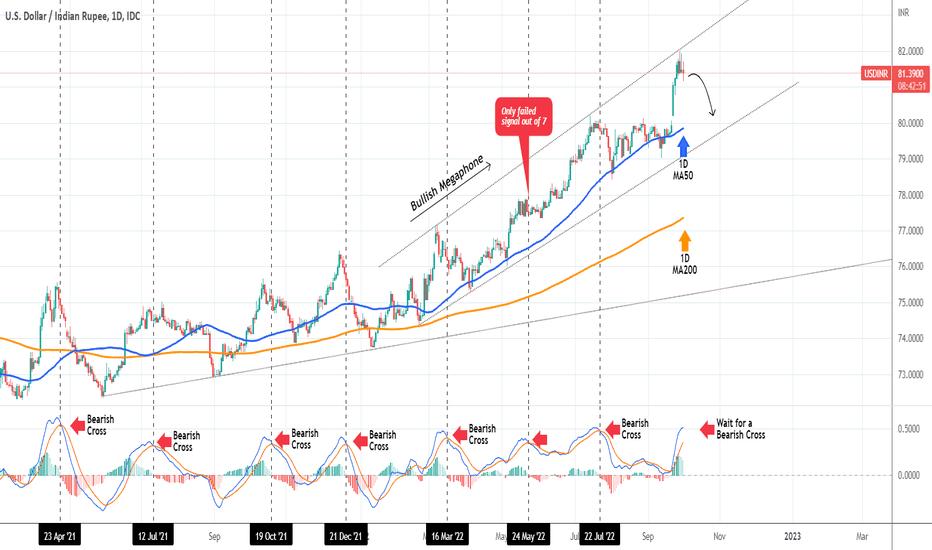
USDINR Sell when the MACD gives a Bearish CrossThe USDINR pair has been trading within a Bullish Megaphone since February 21 2022. Just 2 days ago, the price hit the top (Higher Highs trend-line) of this pattern and got rejected. We may see a pull-back towards the 1D MA50 (blue trend-line) or even the bottom of the Megaphone.
The best confirmation to take that sell trade would be to wait for the 1D MACD to form a Bearish Cross. As you see, since April 23 2021 all seven MACD Bearish Cross occurrences have delivered substantial Lower Lows on the short-term, except for one time (May 24 2022).
-------------------------------------------------------------------------------
** Please LIKE 👍, SUBSCRIBE ✅, SHARE 🙌 and COMMENT ✍ if you enjoy this idea! Also share your ideas and charts in the comments section below! This is best way to keep it relevant, support me, keep the content here free and allow the idea to reach as many people as possible. **
-------------------------------------------------------------------------------
You may also TELL ME 🙋♀️🙋♂️ in the comments section which symbol you want me to analyze next and on which time-frame. The one with the most posts will be published tomorrow! 👏🎁
-------------------------------------------------------------------------------
👇 👇 👇 👇 👇 👇
💸💸💸💸💸💸
👇 👇 👇 👇 👇 👇

