Long IOST - Mainnet Feb 26thWith mainnet launching Feb 26th im looking for a long on IOST.
Looking at the daily chart its obvious that price has now run into resistance at around 173. Ive got two ways to play this, not really sure which one to choose tbh.
First is to wait for 173 to break and then long the retest, second is to long the retest at around 162.
Ive got two setups on chart, lets see which one plays out.
IOSTBTC trade ideas

IOSTBTC a short opportunityThe price action has already touched the sell zone of shark, I would suggest better to lock your profits here. Soon I will post a buy back plan insha Allah.
Regards,
Atif Akbar
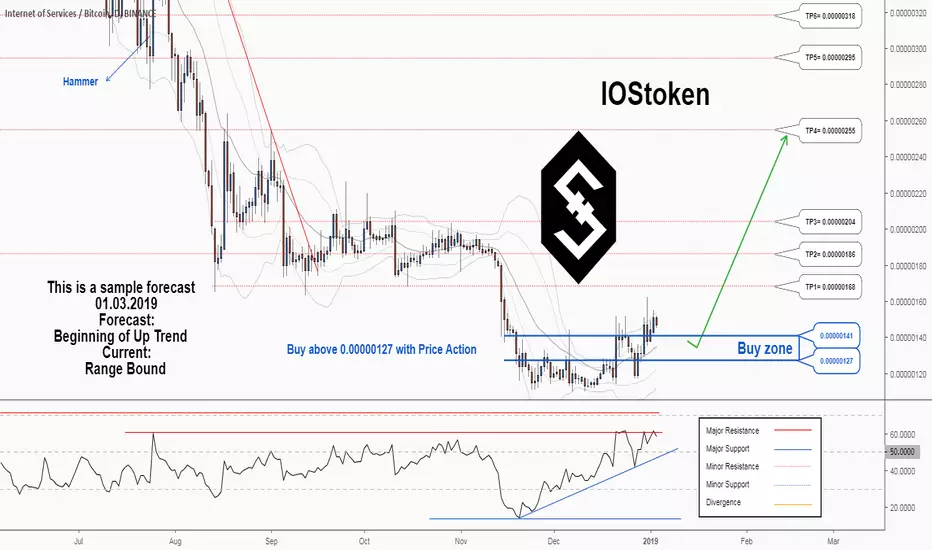
There is a trading opportunity to buy in IOSTBTCTechnical analysis:
. InternetOfServices/Bitcoin is in a range bound and the beginning of uptrend is expected.
. The price is above the 21-Day WEMA which acts as a dynamic support.
. The RSI is at 57.
Trading suggestion:
. There is a possibility of temporary retracement to suggested support zone (0.00000141 to 0.00000127). if so, traders can set orders based on Price Action and expect to reach short-term targets.
Beginning of entry zone (0.00000141)
Ending of entry zone (0.00000127)
Entry signal:
Signal to enter the market occurs when the price comes to " Buy zone " then forms one of the reversal patterns, whether " Bullish Engulfing ", " Hammer " or " Valley " in other words,
NO entry signal when the price comes to the zone BUT after any of the reversal patterns is formed in the zone.
To learn more about " Entry signal " and the special version of our " Price Action " strategy FOLLOW our lessons:
Take Profits:
TP1= @ 0.00000168
TP2= @ 0.00000186
TP3= @ 0.00000204
TP4= @ 0.00000255
TP5= @ 0.00000295
TP6= @ 0.00000318
TP7= @ 0.00000356
TP8= @ 0.00000421
TP9= @ 0.00000486
TP10= @ 0.00000614
TP11= @ 0.00000769
TP12= Free
$IOST bullish scenario$IOST multiple bounce on support
contracting triangle
it can break up or down but it's a good RR for a long
I'm laddering my buy order in this green box

Daily Bullish Signal $IOST #IOST IOST/BTC (30 Dec)BLUE ARROW indicates the EXPECTED Time and Targets
Level Stoploss point up to maximize profit and reduce risk
I'm working all the time, even in Bearish Market

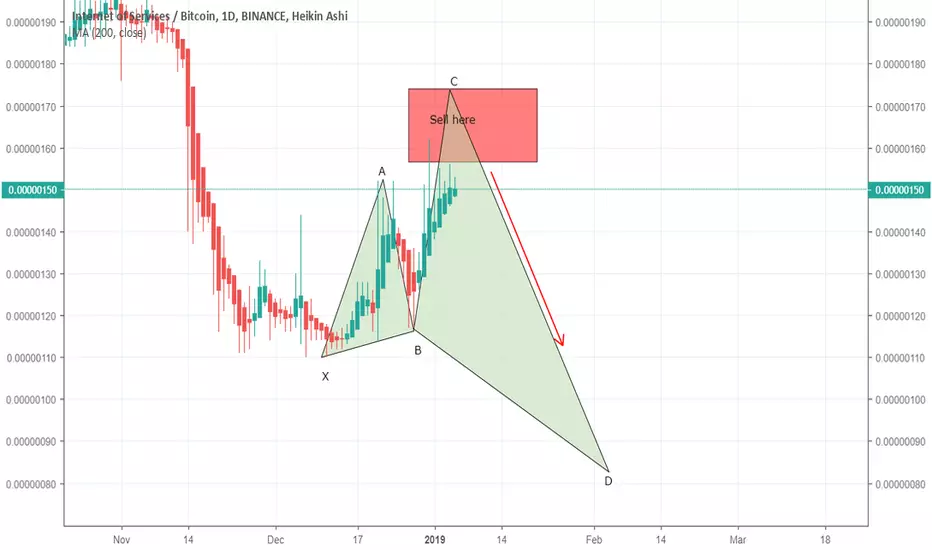
IOSTBTC formation of gartleyIOSTBTC is making gartley insha Allah, the buying and sell zones are defined on chart.
Regards,
Atif Akbar

MY NEXT #ALLinPROJECT coinI Am searching for the best coin I can long everytime with all my capital.
Always very close stop-loss, and NINA signals.
Hope this one bring the 7% minimum profit I need for this project.
turning 0.5 to 50 BTC less in a year.
Good luck.


IOSTBTC Expected decrease and bounceAt the 1-hour timeframe chart it can be seen that a straight Head & Shoulders pattern has been formed and a half of bearish XABCD too.
Technical indicators are also bearish: Stoch RSI is going to hit overbought zone, while DMI shows low, while moving averages suggest a further reverse.
We recommend to fix profit from this bounce around 0.00000128 and rebuy again at 0.00000117

IOSTBTC SHORT PROFITBuy Price: Green Line
Profit: Blue Lines
SL and Historical low: Purple Line
Invest Suggestion: 20 Percent
Profit Expectations: - 5 - 11 - 16 Percent
Just hold and watch. All targets will be reached in a few days.
Sell when you got some profit, according to your way of trade.
I am sure, you will be get nice profit. Good Luck!
IOST is extremaly oversold, it's close to the historical low and is in down!!!!!
Looks Good? Leave a like, share and leave a comment.
Please ask me for any coin address to make a donation.
Thanks for visiting.


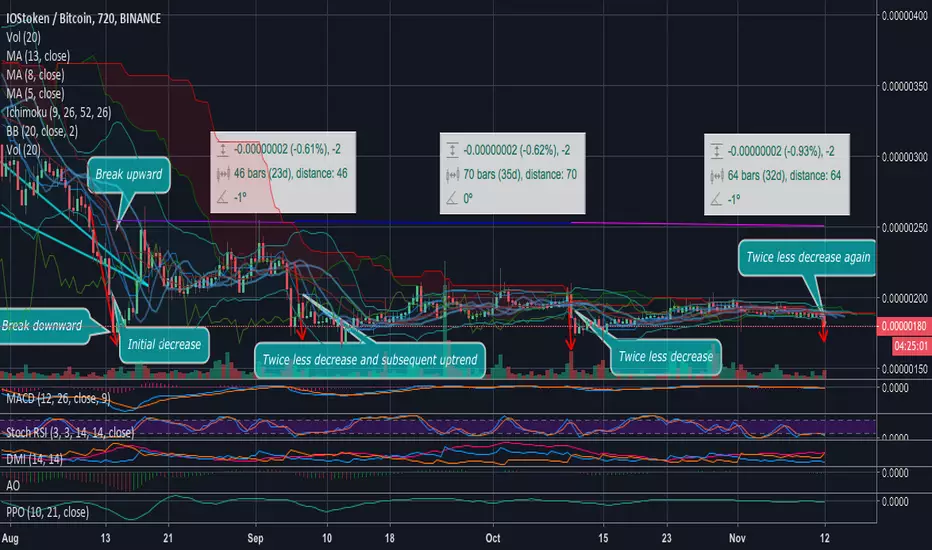
IOSTBTC Fractal movementAt the 12-hours timeframe chart we can observe 180 candles which equals to 90 days. Such frame can reveal patterns that the price movement repeats. One of them is a sharp decrease which becomes smaller and smaller time to time. It started after a double break of the descending triangle. The price can not consolidate: it either being pumped and moves lateral or goes sharply down.
We can observe an uptrend after each decrease which lasts at least 46 candles which equals to 23 days. According to Technical analysis indicators are bullish, while Stoch RSI is in the oversold zone and DMI suggest an upcoming volatility, while volume grows. These are elements of a strong basis for a trend reverse forecast for this coin
Carefully follow the targets in the signal to maximize profit from the price movement
The base of the digital economy. IOST / BTC analyticsBUY: 0,00000171 - 0,00000174
SELL: 0,00000290-0,00000304, 0,00000400 - 0,00000415
STOP-LOSS: -
Support: 0,00000173
Resistance: 0,00000210
The IOST project is building a super-fast blockchain to meet the security and scalability needs of a decentralized economy. The platform should be the basis for future online services.
IOST developers have proposed several innovative solutions aimed at optimizing and improving blockchain scalability. The main innovation in this direction is the Efficient Distributed Sharding technology.
The algorithm of consensus Proof-of-Believability operates on the rules of forming the node reputation. Depending on the number of coins, user activity and his contribution to the system, a rating is formed, dividing the network nodes into approved and standard ones.
On September 12, the asset was forming a minimum at the level of 0.00000163. After that, the price went to the sideways trend with a 20% corridor, which is still in existence. However, the asset in the accumulation zone now, settles in portfolios mainly.
The entrance zone can be set within the range of 0.00000171 - 0.00000174. At this level, we open a long deal for a part of the deposit and observe the price behavior. If the price breaks down this level, then it is possible to move to a minimum and additional analysis is needed.
The first exit point is 0.00000290-0.00000304. But the price can go up sharply, so we sell part of the asset, and if the rate moves higher, then we close the deal at the level of 0.00000400 - 0.00000415.
Daily volatility is in the range of 3-6%. Growth potential is 320-350%.
Of the advantages, it is worth noting that the coin is traded on the largest exchanges. More than half of the volume falls on the trading pair with USDT, which says about the interest of investors. It is difficult to trade during the day due to low volatility, but it is well suited for the medium and long-term.
The coin actively responds to the news, so you need to follow the media background.

IOST BTC Crypto Signal#IOSTBTC
IOST is building an ultra-high TPS blockchain infrastructure to meet the security and scalability needs of a decentralized economy. Led by a team of proven founders and backed by world-class investors, our mission is to be the underlying architecture for the future of online services.
Buy: 190-196
Target:
202
216
235
258
277
SL: 178
Risk/Reward: 6% / 46%
Invest: 3%

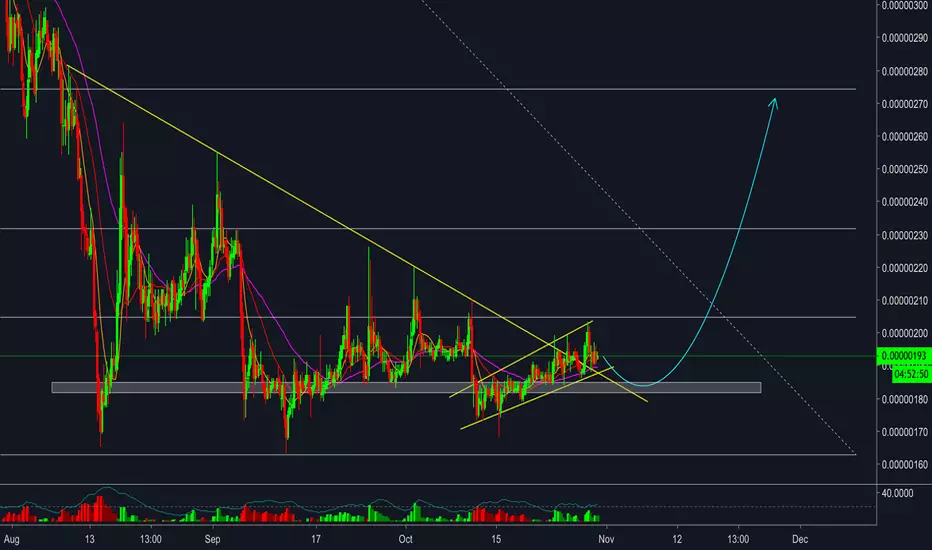
IOST moving to break long term wedge IOST has found support at 184 level and this has been tested multiple times. It looks to move up toward the monthly level at which it will test and most likely reject. After a brief correction it should attempt a move again, this time looking to garner support that wasn't found on first touch.

When will it move, if it ever will?BINANCE:IOSTBTC
This play i hold quite a while now, still not really moved out of accumulation zone, targeting two higher timeframe resistance targets, while keeping stop-loss, a bit under previous swing lows.
Here i would set my stop-loss with a bit room under the lowest swing low in august. Less risky play i would say here.

IOSTOKEN en buena zona de compra Wyckoff no miente, sugiero comprar en 180-190 y vender en nivel de 261% de Fibonacci (entre 230 y 240 Satoshis) que esta muy próximo al LPS.


IOStoken IOSTBTC BINANCEI have finally decided it's time to clear out my Binance altcoin balances and average down any I took a loss at the beginning of the year and sell what I can in profit.
I haven't studied the charts, just drawn up a quick trade to average out and sell in profit so please don't take these as trading advice I just have quite a few and don't want to have to keep drawing charts if I can refer back to these ideas.
1. Long 185
2. Long 170
Take profits will be before the fibs
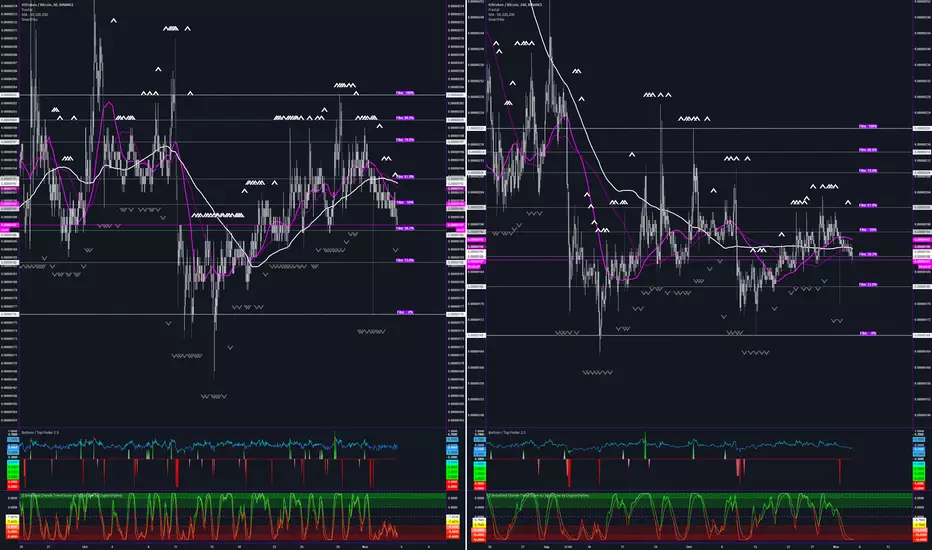
Want to know more about the indicators at the bottom? Please ask

IOSTBTC "IOStoken"Elliot Waves 5 are completed in Major Swings.
Buy Zone 190-191
Sell Zone 201-203
Stop Loss 188

IOST/BTC - Bounce back from support zoneWe need correction to support zone before come to target in middle term
Good luck !