$Iost / $BTC setting up for a push higher$Iost / $BTC setting up for a push higher.
Description: The Internet of Services (IOS) is an Ethereum-based platform that provides its users a way to exchange online services and digital goods. I also enables developers to deploy large scale dApps.
IOS token is an ERC20 token that serves as a medium of exchange on IOS' platform.
Circulating Supply: 8,400,000,000
Total Supply: 21,000,000,000
Upcoming News & Events
Title: Malta Blockchain Summit
Date: 01 November 2018
Description: Malta Blockchain Summit in Malta from Nov 1-2.
Title: USA Blockchain Conference
Date: 14 December 2018
Description: USA Blockchain Conference in Phoenix, Arizona from Dec 14-15.
Title: V0.7 Nike
Date: 31 December 2018 (or earlier)
Description: Deployment of HUDS and supporting modules to testnet.
Title: V0.9 Hermes
Date: 31 March 2019 (or earlier)
Description: Deploying IOSVM to the testnet.
Title: Security Audit
Date: 29 June 2019 (or earlier)
Description: Testing and security audit of the IOS network.
Title: V1.0 Athena
Date: 29 September 2019 (or earlier)
Description: Official release of the IOS network.
Title: DApps Launch
Date: 31 December 2019 (or earlier)
Description: DApps launched to IOS network.
Title: Network Optimization
Date: 31 December 2019 (or earlier)
Description: Optimization with Machine Learning Implementation.
IOSTBTC trade ideas


[IOSTBTC] IOStoken LONG [340% PP]IOStoken (IOSTBTC) hit bottom on the 12th September creating a hammer candlestick (above purple date), a reversal signal, and started to move up increasing almost 40% in value.
On the 11th October its price had strong drop, followed by another drop on the 15th which created a doji candlestick (also marked with purple date). The price bounced higher than the 12th Sept. drop, creating a higher low.
On the 14th August, this same support level was already tested. So it was tested three times in a row and still holds.
Now we have increasing volume and a very strong support. This is a good spot to open a trade, low risk with high rewards. Let’s take a look…
Trade instructions IOStoken
Buy in: 0.00000180 – 0.00000195
Next support: 0.00000170
IOSTBTC Targets by Alan Masters:
(1) 0.00000220
(2) 0.00000240
(3) 0.00000280
(4) 0.00000320
Mid-Long
(1) 0.00000420
(2) 0.00000500
(3) 0.00000580
(4) 0.00000700
(5) 0.00000740
(6) 0.00000845
Stop loss: Close weekly candle below 163.
Capital allocation: <10%.
DO THINK TWICE
When making important decisions, give it plenty of time.
Do think twice.
Take time out to decide.
Take time off for yourself.
Do think twice, always.
Always take your time…
Because patience is key to succeed in this…
Namaste.

Movement in Iost/BtcTechnical analysis:
. IOStoken/Bitcoin is in a range bound and the beginning of uptrend is expected.
. The price is below the 21-Day WEMA which acts as a dynamic resistance.
. The RSI is at 51.
. While the RSI downtrend is not broken, bearish wave in price would continue.
. The price downtrend in the daily chart is broken, so the probability of the resumption of an uptrend is increased.
Trading suggestion:
. There is a possibility of temporary retracement to suggested support zone (0.00000190 to 0.00000165). if so, traders can set orders based on Price Action and expect to reach short-term targets.
Beginning of entry zone (0.00000190)
Ending of entry zone (0.00000165)
Entry signal:
Signal to enter the market occurs when the price comes to "Buy zone" then forms one of the reversal patterns, whether "Bullish Engulfing", "Hammer" or "Valley" in other words,
NO entry signal when the price comes to the zone BUT after any of the reversal patterns is formed in the zone.
Take Profits: check image trading

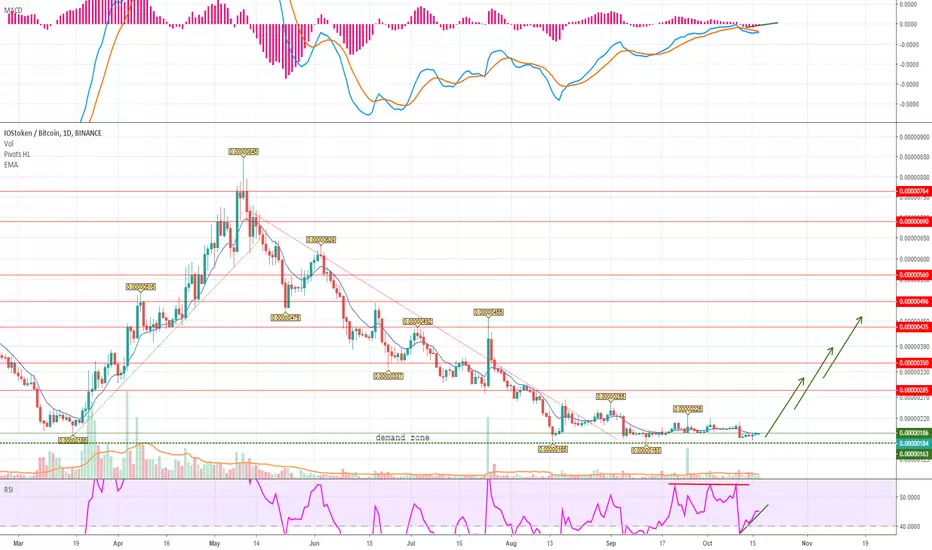
IOST (IosToken) Accumulation EndedHi all! Another low cap, low price asset trapped in our radar.
IOST has ended the down trend while ago, and has been accumulating well around 180-200 sats.
Daily chart shows the FIB resistance will hit the 300 sats easily on a steady market.
Don't forget your stop loss.
Good luck!

IOST H4 (Mainet Q4) Mid term trade/ holdCan hold, no stoplost!
Taker profit like green line.
Goodluck!

There is a trading opportunity to buy in IOSTBTCTechnical analysis:
. IOStoken/Bitcoin is in a range bound and the beginning of uptrend is expected.
. The price is below the 21-Day WEMA which acts as a dynamic resistance.
. The RSI is at 51.
. While the RSI downtrend is not broken, bearish wave in price would continue.
. The price downtrend in the daily chart is broken, so the probability of the resumption of an uptrend is increased.
Trading suggestion:
. There is a possibility of temporary retracement to suggested support zone (0.00000190 to 0.00000165). if so, traders can set orders based on Price Action and expect to reach short-term targets.
Beginning of entry zone (0.00000190)
Ending of entry zone (0.00000165)
Entry signal:
Signal to enter the market occurs when the price comes to " Buy zone " then forms one of the reversal patterns, whether " Bullish Engulfing ", " Hammer " or " Valley " in other words,
NO entry signal when the price comes to the zone BUT after any of the reversal patterns is formed in the zone.
To learn more about " Entry signal " and the special version of our " Price Action " strategy FOLLOW our lessons:
Take Profits:
TP1= @ 0.00000255
TP2= @ 0.00000295
TP3= @ 0.00000318
TP4= @ 0.00000356
TP5= @ 0.00000421
TP6= @ 0.00000486
TP7= @ 0.00000614
TP8= @ 0.00000769
TP9= @ 0.00089900
TP10= Free

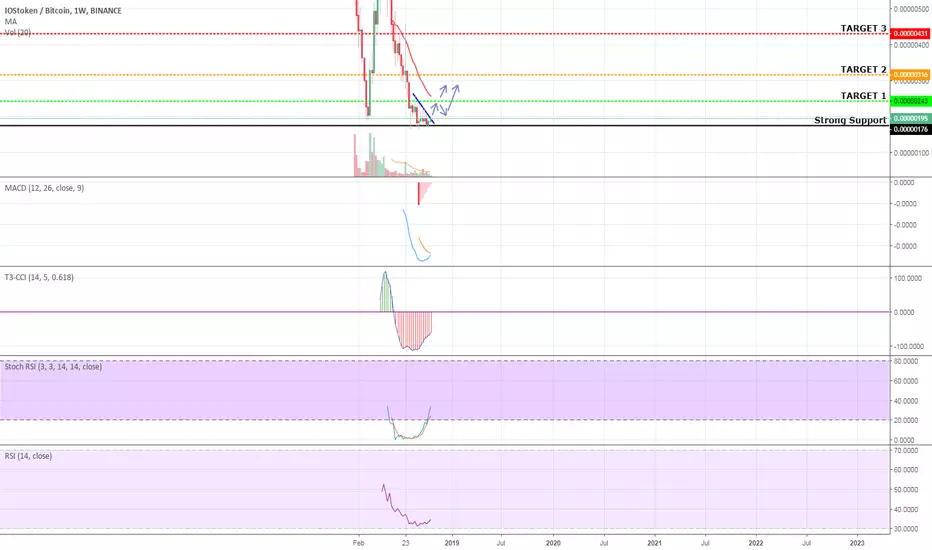
[IOST/BTC] IOStoken ON THE MOVE [ 40-120% POT PROFIT ]#IOST / BTC ( Binance )
Buy Range : 185-190
Stop Loss : Weekly closed below 175
Target 1 : 243
Target 2 : 316
Target 3 : 431
IOST touched the lows on different times since Aug of this year and bottom could be consolidated soon. On short-term, IOST is being pushed up and it could do a good breakout soon.
According to weekly chart ( most important overview ) , this coin looks so good if we look into MACD ( nearly to cross ) , Stoch RSI pointing up, RSI making higher high after touch oversold zone and CCI into the way to turn green on the next month..
Volume isn't great but we could see some big spikes on the low timeframes. Sell pressure dissapeared and i think it could be a very nice moment to go in.
Good luck

Whale Whisperer Here! $IOST isn't Something You Don't Wanna MissIf you search on my profile i've posted IOST long and have a quite nice profit short-term trade. Even that published chart is still on play, i'd like to highlight another short-term rally that would occur on IOST!
At the moment 180-190 sats should be something you need to consider (:

iOST...Treading the Abyss or Ready to Recover?www.tradingview.com
A Retrospective of the Last Run up from the Lowest Support Level:
March 18 186 sats RSI 13
March 21 EMA 7 crosses EMA 25 on the highest bull volume since Binance listed it in Jan
7 Period EMA as Support from March 21 till May 12 when we closed below it after topping out on the 10th of May at 845 sats.
Inside bar bear break with 3 days of downside was probably the first major warning a trend change was about to happen...
Second inside bar bear break on May 14th leading to what has basically been a downtrend ever since aside from a few nice bounces on the way down.
iOST is one I have been watching a lot lately because it has broken below the lowest support level it had established since Binance listed it in late January. From a fundamental analysis perspective it looks like a decent project with potential, but seeing that it had fallen below the March low of 186 sats to hit 163 sats on sep 12th was interesting and alarming. Just judging from previous years we know that not all coins will survive even if they have good ideas. Will iOST be one of them?
In March the RSI was 13, the September low saw the RSI at 36 which left plenty of room for further downside. Double bottom at 173 sats on the 11th and 12 of October respectively. While we've been printing higher lows and lower highs for the last 9 days we still remain trapped between the 7 and 25 period EMAS on the daily and perilously close to the old and new lows. Should BTC see downside to the 6k level or below I expect iOST to test the Sep 12th lows and perhaps even fall further. Below 163 sats there is no support. If I were a gambler and wanted to short, this is one to watch, as we are on the edge of a precipice in a bear market. ANYTHING under 210 sats is just a lower high.
Despite my bearish sentiments regarding this project at the moment on the flip side should BTC break bull and spark a market wide rally this could be a good place to accumulate, and resistance will be at 210, 226 and 255 sats. In my opinion this is a high risk altcoin for bulls right now, but very high reward should the market as a whole turn bull.
I put the retrospective up there in order to see if there were any patterns from the last run up that could give clues for the next possible run.
Thanks for checking in. I hope there is something of use in here. Remember I am NOT an expert, I'm just a random dude on Trading View

IOST is a ticking Timed Bomb!Hey, I am back with another Technical Analysis, this time looking quickly at IOST!
I was looking at altcoins to trade and has find out that IOST token is sitting on a good known support level and has broken even below it.
Ussualy break below support level is not a good indication of bull action but , IOST is doing great job, good stability , low volume , good looking indicator s, perfect risk/reward ratio, my type of trade!
A bit about Indicators .
MACD, histogram uptrend, is about to give buy signal and leave bearish side of MACD.
If IOST continue to see price above 180 sats the buy signal will be given from MACD.
RSI is uptrending , got denied by a triple top, that may been the last bear move.
Buy - 176 sounds like a reasonable entry, 181 is fine too.
Sell - The Red Horizontal lines are representing ressistance levels, assume them as your profit take level slightly below a certain level, depending on your own strategy.
If you like this Technical Analysis, let me know by hitting that agree button , I really do appreciate each one as it motivates by spending more time on doing TA´s, Thanks a lot!
IOSBTC... iOS token has a huge potential. dont miss the trainhey my friends hope you're all fine and taking profits. here is my iOS token chart please give some advice if i'm wrong.
price seems that its accumulating and some reversal signs and patterns occurred.
good luck


IOST Trading AdviceBuy Price: Yellow Line
TP: Green Lines
Invest Suggestion: 5-10 Percent
Profit Expectations: 5, 10 or >20 Percent
Just hold and watch. All targets will be reached within 24 to 72 hours as my prediction. But it's recommended to hold it for 6-7 days if any target not reached. Sell when you got some profit. I am sure, you will be get nice profit. Good Luck!
Looks Good? Leave a like, share and tell me in comments if my trading advices are working for you or I am just wasting my time and effort.
Thanks for visiting.

$IOST Really At A Bargain Price. Why?Because the chart is bottomed. I really don't want to type a lot at the moment. Will catch up on the comment section of mine for more detail later. Why I'm publish this right now, because in the crypto game, momentum is everything so i don't want to lose that.
Detail on the comment. IOST is on accumulation phase and sitting pretty. Targets you can see on the chart that i drew the fib level.
If this ideas helps you, give it a thumbs up, comments and follow me. Thanks a lot!


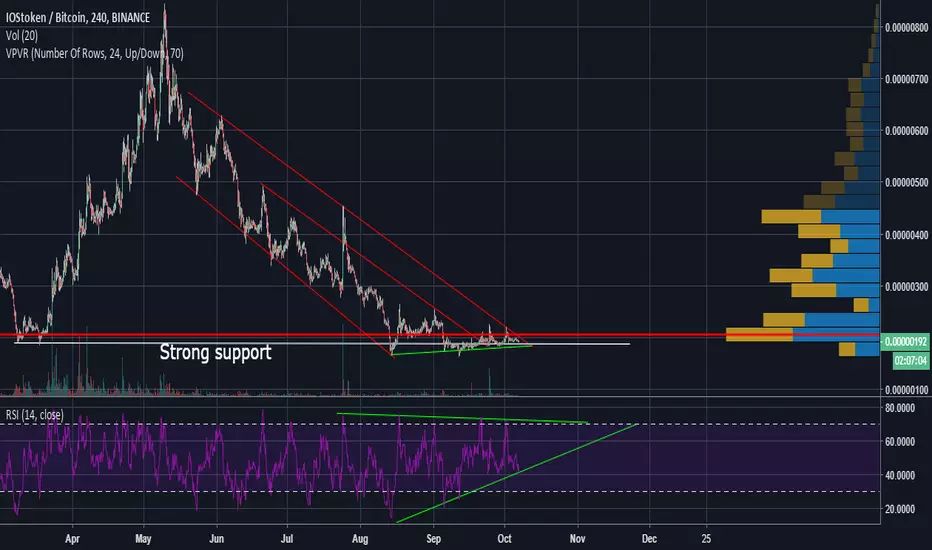
IOST/BTCRisk : High, Long terme, Early entry
Coin: IOST/BTC
Exchange: Binance
Entry Zone: 0.00000187 or 0.00000195
Target 1 : 0.00000211 (9%)
Target 2 : 0.0000023 (20%)
Target 3 : 0.0000026 (34%)
Stop Loss: 0.00000174 (10%)
Comment :
Sitting on a strong support
Strong consolidation
Symetrical triangle pattern
Long terme position.

IOSTBTC : It's ready!IOST has reached it's lowest low and has formed a double-bottom.
After a long consolidation, it's now ready to move up with it's latest news.
Volume has been growing immensely since end of last month.
The news are there with their latest release of Everest EVM v1.0. They have announced performances surpassing EOS which is quite promising!
Not a professional advice
