IOST/BTC Correction Over ( 3rd Impulse Coming)Many alts have found market bottom after the recent crash with a promising reversal on the way.
IOST Has finished ABC correction after 1st impulse.
Hidden Bullish Divergence is clear with BOTH RSI and STOCH. MACD is also crossed over bullish.
R/R for this trade is -25% for a chance of 142%.
Buy in - 400-420
Targets:
477
616
766
973
Stop Loss: 289
IOSTBTC trade ideas

IOST Bouncing off of Prior Descending Wedge IOST Bounced off of the the top resistance line of the descending wedge it was previously in. The T.D. Sequential is currently showing a 13 countdown buy signal on the 4 Hour Chart. Bullish divergence present on the 4 Hour RSI and StochRSI.

IOST breakout imminentBullish divergence on the RSI daily as the price is decreasing. .618 Fib retracement suggests 20% profit potential.

Bullish Divergence IOSTBTCIOST is showing three divergences, it is bullish on EFI, MACD-H and RSI
I Think the first target is realistic, but I have set an alert when it is about to hit the price around the EMA.
I have to see if I get out, or look for strength and see the price hit the +1 ATR
Entry: 0.00000365
Target 0.00000374
Target 2 0.00000381
SL: 0.00000360
Target 1 R/R Ratio: 1.8
Target 2 R/R Ratio: 1:3

Like if you are bullish-comment if bearish Guys do you think we have the momentum to break 390-395 Sat in a short amount of time??
Please let me know toward which color we are heading, orange or Green first??
Thanks
#G.Baz - #TheColorchartist - #ChartsInColors
IOSTBTC; TargetsHello fellow traders,
The time has come. It looks like we are ready for the next leg up. If not now, very soon.
There are multiple positive signs that this contraction is over:
1. Bullish RSI Reversal Divergence
2. Twin Peak on AO
3. Cup and Handle where the handle has completed (or very soon about to complete) a falling wedge with a perfect ABCDE
4. Broke up from the symmetrical triangle
Good luck and have fun!

A trading opportunity to buy in IOSTBTC Technical analysis:
. IOSTOKEN/BITCOIN is in a downtrend and the beginning of uptrend is expected.
. The price is below the 21-Day WEMA which acts as a dynamic resistance.
. The RSI is at 45.
. The RSI downtrend #1 & The price downtrend in the daily chart are broken, so the probability of resumption of uptrend is increased.
Trading suggestion:
. The price is in a downtrend and we forecast the uptrend would begin.
. There is a possibility of temporary retracement to suggested support zone (0.0000036 to 0.0000031). if so, traders can set orders based on Price Action and expect to reach short-term targets.
Beginning of entry zone (0.0000036)
Ending of entry zone (0.0000031)
Entry signal:
Signal to enter the market occurs when the price comes to "Buy zone" then forms one of the reversal patterns, whether "Bullish Engulfing" , "Hammer" or "Valley" in other words,
NO entry signal when the price comes to the zone BUT after any of reversal patterns is formed in the zone.
To learn more about "Entry signal" and the special version of our "Price Action" strategy FOLLOW our lessons:
Take Profits:
TP1= @ 0.00000408
TP2= @ 0.00000477
TP3= @ 0.00000518
TP4= @ 0.00000568
TP5= @ 0.00000616
TP6= @ 0.00000703
TP7= @ 0.00000763
TP8= Free

IOST (IOST)2 Buy signal
The first signal
Buy around 0.00000338/0.00000305
Targets
0.00000366
0.00000403
Stop_loss
Close below 0.00000300 daily
Risk / Reward :
3 % / 20%
Invest : 3%
Sec Signal
Buy around 0.00000226/0.00000186
Targets
0.0000024
0.00000289
0.00000401
0.00000468
Stop_loss
Close below 0.00000174 daily
Risk/Reward:
6% / 151%
Invest : 5%
We ask Allah reconcile and repay
Iost SetupBuy: Current price or lower
Sell: 481+
Stop-Loss: 397
*Possible pull back to low 400's before going higher

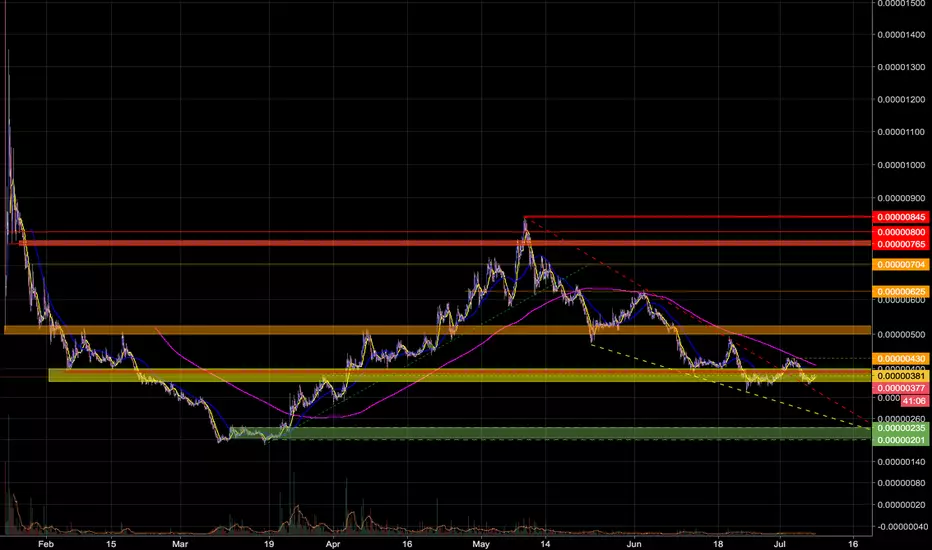
IOST projectionsWe've been seeing some strength. Here are our targets for our beloved IOST.
The horizontal red line represents resistance that must be broken.
The blue line marking our last significant high at 845 must be breached in order to confirm these price targets.
Keep in mind that the horizontal lines can act as resistances and supports during our trade. Good luck.

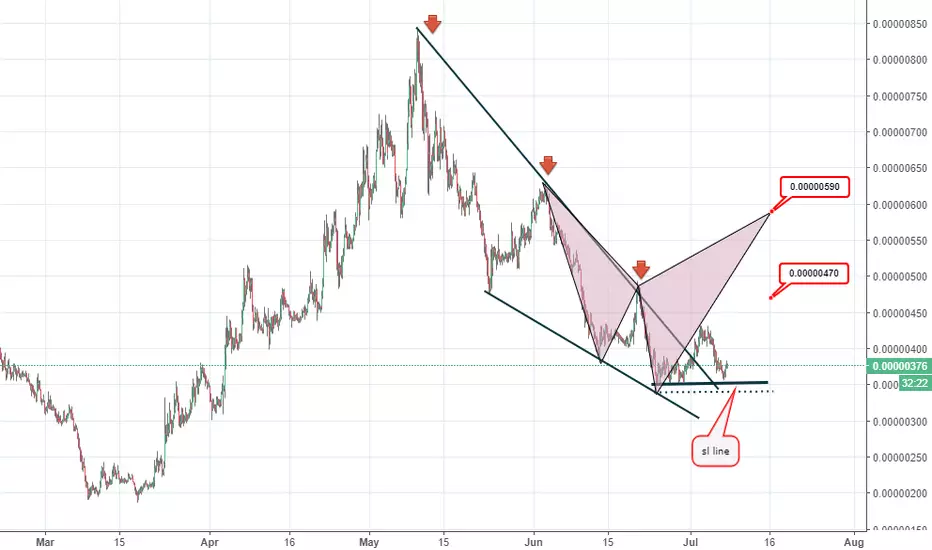
IOSTBTC 240 Binance , Ready to go beyond moon !Coin - IOST
Exchange - Binance
Buy 390-405
Sell 470-500-570
SL 370 !
TA : Broken out in 4H time frame from a Falling wedge with volume !
Green zone is first resistance zone (470-505)
breaking here will lead to second green zone ( 570-590)
Buy in parts and also sell in parts
Good Luck ! :)

$IOST / $BTC #IOST may offer some good trade$IOST has consolidated for a while now. this is getting ready for a run just waiting for BTC to settle down.
Description: The Internet of Services (IOS) is an Ethereum-based platform that provides its users a way to exchange online services and digital goods. I also enables developers to deploy large scale dApps.
IOS token is an ERC20 token that serves as a medium of exchange on IOS' platform.
Circulating Supply: 8,400,000,000
Upcoming News & Events
Title: EDS and PoB Testing
Date: 29 June 2018 (or earlier)
Description: "Implementing and testing EDS and PoB on the test net (v0.5 Janus)."
Title: Document Draft
Date: 29 September 2018 (or earlier)
Description: "Releasing IOS smart contract document draft."
Title: V0.7 Nike
Date: 31 December 2018 (or earlier)
Description: Deployment of HUDS and supporting modules to testnet.
Title: V0.9 Hermes
Date: 31 March 2019 (or earlier)
Description: Deploying IOSVM to the testnet.
Title: Security Audit
Date: 29 June 2019 (or earlier)
Description: Testing and security audit of the IOS network.
Title: V1.0 Athena
Date: 29 September 2019 (or earlier)
Description: Official release of the IOS network.
Title: DApps Launch
Date: 31 December 2019 (or earlier)
Description: DApps launched to IOS network.
Title: Network Optimization
Date: 31 December 2019 (or earlier)
Description: Optimization with Machine Learning Implementation

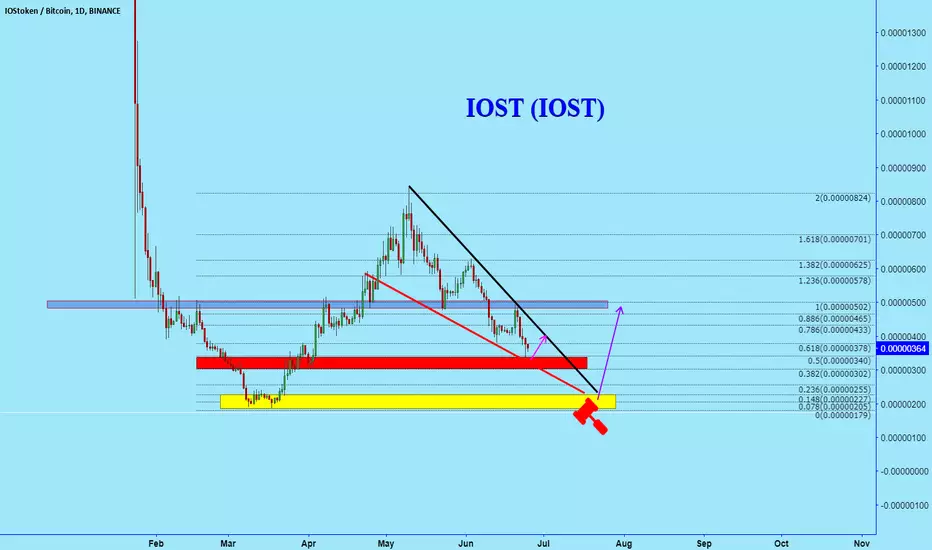
IOST ProjectionsIOST has been showing some volatility. Let us try to make some extra profit from our IOST stacks.
A closer view of the action.
I have traced out 3 waves and marked their potential targets in their respective colors. If the upper limits of the orange wave are broken, the orange targets are active. The most ambitious orange target is actually the upper limit for the green wave. If the upper limit of the green wave is broken, the green targets are in play up to 1100s.
If the lower limit of the red wave is broken, the red targets will be active.
Happy trading. I am personally bullish on iost.

Triangle Breakout in $IOSTBTCBulls have everything to prove in this market. Based on overall market I have adjusted my time-frame to be shorter.
Plan is to sell half at the resistance at 400 and then after that see how it reacts.
On a failed breakout through 400 I would sell the other half right away.
Stop loss is set at the beginning of the breakout move (at 376 ish)

IOST BTC - Higher time frame pattern fractal - food for thoughtOn the higher time frames we see a repeating pattern. A so-called pattern fractal. I think we are currently trading on the lower bound of the mean growth channel.
On the lower time frames (hourly) we are currently working out wave C before going higher.
No financial advise..
440'ish seems to be a nice entry point.


A new trading opportunity to buy in IOSTBTCTechnical analysis:
. IOSTOKEN/BITCOIN is in a range bound and beginning of uptrend is expected.
. The price is below the 21-Day WEMA which acts as a dynamic resistance.
. The RSI is at 42.
. While the RSI downtrend #1 and the price downtrend in daily chart is not broken, bearish wave in price would continue.
Trading suggestion:
. The price is in a range bound and we forecast the uptrend would begin.
. There is a possibility of temporary retracement to suggested support zone (0.00000400 to 0.00000356). if so, traders can set orders based on Price Action and expect to reach short-term targets.
Beginning of entry zone (0.00000400)
Ending of entry zone (0.00000356)
Entry signal:
Signal to enter the market occurs when the price comes to "Buy zone" then forms one of the reversal patterns, whether "Bullish Engulfing" , "Hammer" or "Valley" in other words,
NO entry signal when the price comes to the zone BUT after any of reversal patterns is formed in the zone.
To learn more about "Entry signal" and the special version of our "Price Action" strategy FOLLOW our lessons:
Take Profits:
TP1= @ 0.00000477
TP2= @ 0.00000518
TP3= @ 0.00000568
TP4= @ 0.00000616
TP5= @ 0.00000703
TP6= @ 0.00000763
TP7= Free

IOSTBTC on BINANCE: Jun 19: ChangesI've adjusted the chart of the bullish triangle so it better aligns with the extremities of the chart. As you can see when adjusted, the bullish triangle seems like it may very well exit the triangle from 440 satoshis within the following weeks. It is advised to leave a buy order somewhere along 440 satoshis so one doesn't miss the end of the bullish triangle/wedge.
If it continues further, my previous estimates apply.
I'll continue to update as seen needed.
-LC2020

IOST/BTC on BINANCE Jun 18: Bullish TriangleWelcome to my IOST/BTC Binance trading pair evaluation this June 18, 2018.
IOST, or better known as the IOS token, is shown here on TradingView on the 1 Day chart.
On Mar 8th to 18th of 2018 the IOS token created a double bottom chart pattern with a final closing value of 210 satoshis, resulting in an uptrend pattern that continued until May 16th, 2018. On that day in May, the IOST chart created a known "fakey" setup, resulting in the IOS token achieving a peak value of 845 satoshis on the uptrend.
Since May 16, the chart has been on a steady decline; however, as shown on this candlestick chart one can see that IOST is currently in a bullish triangle that began from the hammer candlestick on May 7th according to the chart patterns.
This is confirmed on May 23 when the trend refuses to sink past 475 satoshis or rise above 629 satoshis on June 3rd. As you can see from the last 8 candlesticks in the daily chart you can see the bears are slowly getting exhausted, giving the bulls a chance to take over the market.
Based on the bullish triangle, we should see the bulls take over the market sometime around the first week of July, when the IOS token achieves a value between 290 to 330 satoshis. From there, based on the base range of the bullish triangle, you should expect the price to thereafter increase by a minimum of an additional 317 satoshis, or roughly by 100% or more in the days after.
If this triangle fails, stay advised to wait and see it bounce back from the first support at 299 satoshis. If the price falls through there, then await the second support created by the double bottom at the value of 0.00000189 BTC per IOST.
As always, do pay attention to the news and watch the changes in the chart for IOST/BTC on BINANCE. I will try to keep posted of any changes.
-LunarCafe2020

