IOSTUSD trade ideas


IOST at best place for midterm entry!!IOST another altcoin could give us high profit in midterm.
TPs:
1-0.0384
2-0.0737
3-ATH
4-0.235


IOST/USDT 1W MidTerm🔘 16/26
💲 IOST/USDT
🕔 Mid Term / 3 to 6 months
🛑 Stop loss NOT NEEDED
💵 Recommended Investment : 5% of portfolio

IOST BULL long RUN INCOMING ....More than 2000% Growth potenti!?Although IOST is not as well known as ETH, it has taken very important steps towards the development of crypto and blockchain technology in 2018 and 2019. In fact, in mid-April 2019, the project reported that it was processing more transactions than ETH Blockchain.
IOS is an ambitious project that can prove to be a better solution than ETH, EOS or Neo.
Of course, this project competes with many other Blockchain that have been created for organizational acceptance. Technology startups are working to fix the shortcomings of the crypto space, and the survival of IOST depends on this key factor.
IOS uses sharding and a credible proof-of-consensus mechanism to enhance the scalability and security of Blockchain 2.0 smart contract networks.
IOS is built for enterprise use and can process heavy data generated by technology companies such as Amazon, Facebook and Google .
Partnerships are critical to the success of iOS because its core network seems to be living up to its promise.
IOS has big ambitions, although only less than half of its tokens are in circulation. 40% of it is available from the time of sale, 10% is allocated to its team, 2.5% to consultants and 47.5% to the foundation and community building. So we have to wait for the product of the work to know if this is a plan, a dream or the next success story of blockchain.
👉This analysis is my personal opinion and you are responsible for your own trades or invests.
❤️Best Regards and successful trades.......


I-O-S-T CT - Aretha FranklinWhat you want
Baby, I got it
What you need
Do you know I got it?
I-O-S-T CT
You know what it means to me
Buy, Just a little bit
common Buy Just a little bit
ARE YOU READY FOR THE IOST RocketSHIP!!!!!
In my honest opinion this Altcoin is the #1 Crypto under $0.01
On the 12th August it passed all buying rules in my 2daychart system which if traded BTC using it since 2013 you would have over $16Million starting with $10,000
Here is a recap of buying instructions:
Price closes above 20MA but the 20MA must be in an upward direction
or
(10) EMA over the (20) EMA
Stochastic RSI upward but at least 1 line not above 80 Cannot have any line above 80 for 2 days
MACD bullish Inputs 8,26,9
if all rules are met buy on the next 2day
So in this case a buy entry was made on the 14th August
Exit strategy cannot be used for this Coin you will forgive alot of profit so Best way to place this is by FibRetracement and MFI / RSI
This is not the only buy entry given. This week 17th August (Q) Position entered as it passed weekly System
Price closes above 20MA but the 20MA must be in an upward direction
Stochastic RSI upward but at least 1 line not above 80
MACD bullish Inputs 8,26,9
The 3rd reason why I am very Bullish on IOST is that it looks like it will pass rules for the Weekly system this week for the BTC pair ( IOSTBTC )
OK Fibonacci Exit points
$0.0608
$0.079
$0.097
$0.25
$0.66
Resistance points
$0.082
$0.086
$0.097
$0.01213
$0.017
$0.01927
$0.039
$0.079

IOSTUSD - 1 HourI will share my thoughts on the current market situation and any possible targets. You can make your conclusion out of this and make your own decision how to play it!
A lot of ALTS are looking ready to take a big move upwards!
IOSTUSD
On the 1 hour chart we see a ascending triangle and the range is getting tight. Ready to boom
Guys, my goal is to reach my first 100 followers this month! A like and follow is all I need and its FREE! Thank you

IOSTUSD - 6 HI will share my thoughts on the current market situation and any possible targets. You can make your conclusion out of this and make your own decision how to play it!
IOSTUSD : I expect a bounce to 0.0051, if we fail to break resistance I see 0.0035 on the chart!
As always, patience is key.
Would you like to see more of my ideas? Please give me a follow. Thanks for your support!

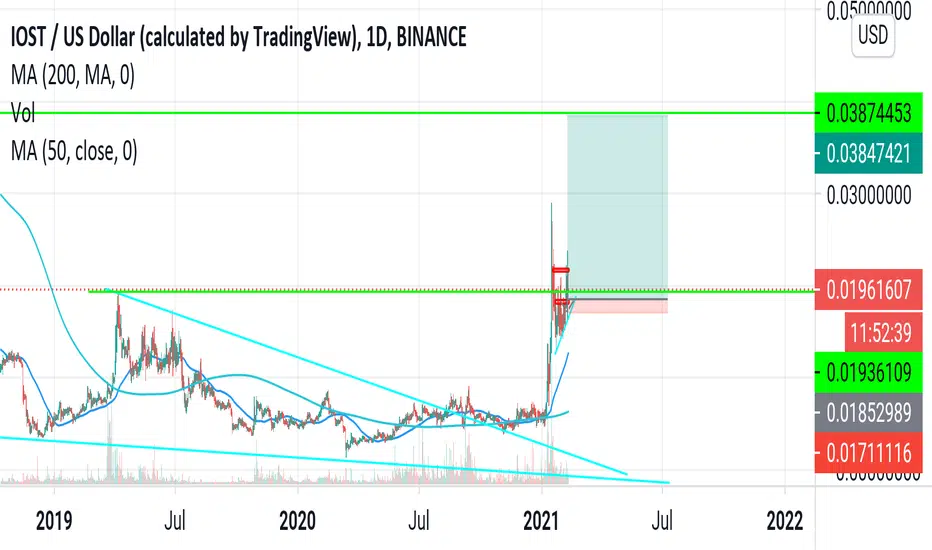
IOSTUSDWhile IOST hasn't seen it, the base price is 0.00686290, 100MA.
It is far from the historical downtrend line and far from the base price of 0.01050258.
Keeping prices above 100MA and 0.00686290 points, we believe 300MA, the downtrend line and the touch of 0.01050258 points are important challenges.
If we go back below the 0.00686290 point and maintain our price, it would be difficult to see a significant rise in the bull market, which is likely to rise in the second half of next year or the next year.

IOSTUSDI think one of the coins with a high volume of trading in a similar coin market cap ranking is IOST.
As with other coins, the chart fell by falling a lot.
The peculiar spot on the weekly chart is that the RSI has moved below 30 and then up.
I think it's a good place to start, and there's been a lot of trading at the low price of 0.00686290.
The inflection date for the IOST is around January 2020.
If you touch the 0.01050258 point before that, I think there is a possibility of arriving at the 0.01934575 point in a faster period.
I think it's an IOST that's about to change next year.
I think we are drawing a notable chart.

IOSTUSD hold of the year. Follow the volume with a great Risk/Reward ratio. Target price is 0.06 USD with a possible continuation (depends on a market conditions).

There is a trading opportunity to buy in IOSTUSDTechnical analysis:
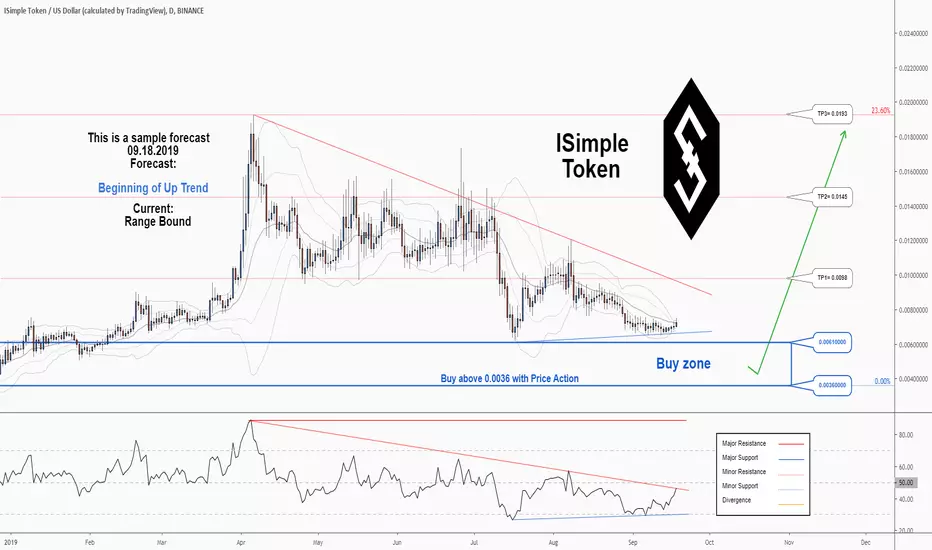
. Isimple/Dollar is in a range bound and the beginning of uptrend is expected.
. The price is below the 21-Day WEMA which acts as a dynamic resistance.
. The RSI is at 47.
. While the RSI downtrend and the price downtrend in the daily chart are not broken, bearish wave in price would continue.
Trading suggestion:
. There is a possibility of temporary retracement to suggested support zone (0.00610000 to 0.00360000). if so, traders can set orders based on Price Action and expect to reach short-term targets.
Beginning of entry zone (0.00610000)
Ending of entry zone (0.00360000)
Entry signal:
Signal to enter the market occurs when the price comes to " Buy zone " then forms one of the reversal patterns, whether " Bullish Engulfing ", " Hammer " or " Valley " in other words, NO entry signal when the price comes to the zone BUT after any of reversal patterns is formed in the zone. To learn more about " Entry signal " and the special version of our " Price Action " strategy FOLLOW our lessons :
Take Profits:
TP1= @ 0.00980000
TP2= @ 0.01450000
TP3= @ 0.01930000
TP4= @ 0.02896000
TP5= @ 0.03680000
TP6= @ 0.04750000
TP7= @ 0.07000000
TP8= Free

There is a trading opportunity to buy in IOSTUSDTechnical analysis:
. Isimple/Dollar is in a range bound and the beginning of uptrend is expected.
. The price is below the 21-Day WEMA which acts as a dynamic resistance.
. The RSI is at 47.
. While the RSI downtrend and the price downtrend in the daily chart are not broken, bearish wave in price would continue.
Trading suggestion:
. There is a possibility of temporary retracement to suggested support zone (0.00610000 to 0.00360000). if so, traders can set orders based on Price Action and expect to reach short-term targets.
Beginning of entry zone (0.00610000)
Ending of entry zone (0.00360000)
Entry signal:
Signal to enter the market occurs when the price comes to " Buy zone " then forms one of the reversal patterns, whether " Bullish Engulfing ", " Hammer " or " Valley " in other words, NO entry signal when the price comes to the zone BUT after any of reversal patterns is formed in the zone. To learn more about " Entry signal " and the special version of our " Price Action " strategy FOLLOW our lessons :
Take Profits:
TP1= @ 0.00980000
TP2= @ 0.01450000
TP3= @ 0.01930000
TP4= @ 0.02896000
TP5= @ 0.03680000
TP6= @ 0.04750000
TP7= @ 0.07000000
TP8= Free
IOST almost ready for a buy againShoulder didn't hold. So Idea 2 is now in place.
Will search for an INV head n shoulder "mini" inside a long drawn out right shoulder. I mean...if we get another buy again at .005 I won't complain lol...
long from .0045
TP: .0225
TP2: .03
TP3: .042


IOST Price Analysis IOST / USD: Swift DevelopmentFundamental Analysis
IOST spiked after the project announced that it is planning to participate in the biggest gaming expo and struck multiple partnerships with traditional game publishers. This could help the project to further expand its ecosystem and increase the adoption of its platform.
IOST / USD Short-term price analysis
IOST has a bullish short-term trading bias, with the IOST / USD pair recovering above its key 200-period moving average on the four-hour time frame.
The four-hour time frame is showing that a bullish technical breakout has occurred, with the IOST / USD pair breaking above a large descending wedge pattern. A bullish moving average crossover is also in play across the mentioned time frame.
Technical indicators on the four-hour time frame are bullish and continue to issue a buy signal.
Pattern Watch
Traders should note that a bullish triple-bottom pattern is also in play across the daily time frame.
Relative Strength Index
The RSI indicator on the four-hour time frame is bullish, although it has now reached overbought conditions.
MACD Indicator
The MACD indicator on the four-hour time frame is bullish, with both the MACD signal and histogram issuing buy signals.
IOST / USD Medium-term price analysis
IOST has a bullish medium-term outlook, with the IOST / USD pair rallying above its trend defining 200-day moving average.
The daily time frame is showing that bulls have moved price back inside a neutral wedge break is still underway, following a false bearish breakout.
Technical indicators on the daily time frame are bullish and continue to generate buy signals.
IOST / USD Daily Chart by TradingView
Pattern Watch
Traders should note that we may see bulls forcing the IOST / USD pair back towards the top of the wedge pattern.
Relative Strength Index
The RSI indicator on the daily time frame has turned bullish and is issuing a strong buy signal.
MACD Indicator
The MACD indicator on the daily time frame is bullish, with both the MACD signal line and histogram issuing buy signals.
Conclusion
The recent rally in the IOST pair has dramatically changed the short and medium-term technical picture for the cryptocurrency.
If bulls can hold onto recent gains, the bullish patterns on both time frames suggest we could see more upside ahead for the IOST / USD pair.

IOST Price Analysis IOST / USD: Not Enough PowerIOST / USD Short-term price analysis
IOST has a bearish short-term trading bias, with the IOST / USD pair still trading below major technical support on the four-hour time frame.
The four-hour time frame is showing that a technical breakout in the IOST / USD pair is nearing, as price remains trapped between horizontal resistance and rising trendline support.
Technical indicators on the four-hour time frame are bearish and continue to issue a sell signal.
Pattern Watch
Traders should note that a bullish double-bottom pattern is also in play across the daily time frame.
Relative Strength Index
The RSI indicator on the four-hour time frame is bullish, although a bearish double-top pattern may be forming.
MACD Indicator
The MACD indicator on the four-hour time frame is bullish, with both the MACD signal and histogram issuing buy signals.
IOST / USD Medium-term price analysis
IOST has a bearish medium-term outlook, with the IOST / USD pair unable to move above its trend defining 200-day moving average.
The daily time frame is showing that a bearish wedge break is still underway, with bulls repeatedly failing to move price back inside the neutral pattern.
Technical indicators on the daily time frame are neutral and are currently failing to generate a clear trading signal.
IOST / USD Daily Chart by TradingView
Pattern Watch
Traders should note that the bearish wedge pattern breakout on the daily time frame still has significant downside potential.
Relative Strength Index
The RSI indicator on the daily time frame is approaching neutral and currently has a slight bearish bias.
MACD Indicator
The MACD indicator on the daily time frame is neutral and is currently failing to issue a clear signal.
Conclusion
The overall short and medium-term bearish outlook for IOST remains unchanged, despite the recent upside recovery in the cryptocurrency.
The daily time frame clearly shows that unless buyers move price back inside the wedge pattern, the IOST / USD pair could still see significant downside ahead.
IOST Price Analysis IOST / USD: Breaking Out The Wrong WayIOST / USD Short-term price analysis
IOST has a bullish short-term trading bias, with the IOST / USD pair dropping below major technical support on the four-hour time frame.
The four-hour time frame is showing a bearish technical breakout is currently underway, with the IOST / USD pair trading under a well-defined wedge pattern.
Technical indicators on the four-hour time frame are bearish and continue to issue a sell signal.
Pattern Watch
Traders should note that the downside target of the wedge pattern is located around the March 2019 trading low.
Relative Strength Index
The RSI indicator on the four-hour time frame is bearish, although it has now moved into oversold territory.
MACD Indicator
The MACD indicator on the four-hour time frame is heavily bearish, with both the MACD signal and histogram issuing strong sell signals.
IOST / USD Medium-term price analysis
IOST has a neutral medium-term outlook, with the IOST / USD pair currently testing its trend defining 200-day moving average.
The daily time frame is showing that the IOST / USD pair has fallen sharply lower, following the latest bearish rejection from the neckline of a large inverted head and shoulders pattern.
Technical indicators on the daily time frame have turned bearish and continued to issue a strong sell signal.
IOST / USD Daily Chart by TradingView
Pattern Watch
Traders should note that a complex inverted head and shoulders pattern may be taking shape across the daily time frame.
Relative Strength Index
The RSI on the daily time frame has turned bearish and shows scope for further downside.
MACD Indicator
The MACD indicator on the daily time frame is bearish and is currently issuing a sell signal.
Conclusion
IOST has performed a much-awaited technical breakout on the four-hour time frame, following an extended period of range trading inside a large wedge pattern.
Medium-term bulls may use a deeper pullback towards the March 2019 trading low as an opportunity to re-enter the IOST / USD long trade at a more attractive price.
