IOST / USDT Price Action AnalysisHi traders,
This will be a very quick and simple chart on IOST
Now, how has the price for IOST been performing?
Well after reaching an all-time-high level on February 19th, IOST/USDT started to correct the gains towards a key pivot level shown here in orange.
-However, the launch of mainnet could create another spike towards last week’s highs or perhaps even higher. with the supertrend indicator we can clearly see the corrections and support.
-The pair has been enjoying a healthy uptrend on the daily chart, above the Ichimoku Cloud, so if the mainnet launch goes smoothly, the choppy corrections could provide a buying opportunity.
-For more chart analysis on the crypto market follow, and if you agree with this, like and share.
IOSTUSDT trade ideas

IOST USDT iost uptade for those who was bought with us
and now for those who want to buy i am prefer after closed 1 day candle above 0.087
and use stop loss
please donot forget risk managment

iostusdt sell sterategy Highest price 0.09171 and 0.09071
sterategy 1 :
Those who bought at the price of 0.01681 will save 50% of the capital In the price 0.09171
And in case of resistance failure and re-formation of the pullback
sterategy 2 :
Save the total capital in the price range 0.09171 and 0.09071 and wait for the resistance to fail
Take the sensitive points of resistance and support seriously

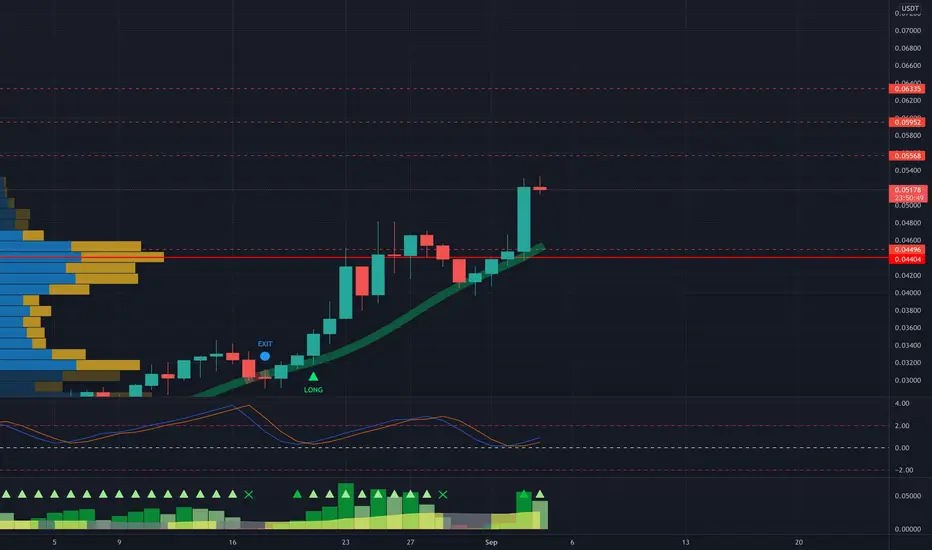
Going long for IOST for a x2 returnThe chart of IOST looks very interesting. Give it that it's not one of the hot alt coins but investors always have to widen the search scope to looks for potential coins.
There are a few bullish indicators in the chart
The daily chart is forming a cup pattern with a double bottom, reaching the resistance at 0.046. There is a supply zone in there. Keep tract on the daily candles to see if it closes above it.
The golden cross forming
The RSI , however, is at the overbuying zone. This is usually a good thing especially in crypto as it shows interest in buying. But the coin might cool off abit before taking off again.
My target prices are as shown in the chart, hopefully it can reach the price of ATH

IOST recovered already?This looks bullish, IOST cpmpletely recovered from that ride yesterday... If this resistance level that we are at, holds, we could expect another leg up. Since indicators are relatively high, we could also expect a retest of the previous support level at 0,05893. If that support is potentially lost (due to BTC possible next move down) we could open short scalp trade also... Good luck traders

IOST/USDT Rounding bottomIOST is another coin pulled back quickly after the market crash and turned bullish in short period. It is currently moving towards the resistance and completing the rounding bottom pattern. Wait for the breakout and confirmation before entering.
Warning - we might see a fake breakout so wait for the candle to close above the breakout. Also this might turn into a cup and handle pattern so be cautious.
This is not financial advice please DYOR

$IOST ATH Re-testI don't make the rules. IOST will pump just like all these other dinosaur layer-1 and layer-2 solutions

IOTS, NEW BULLISH PREDICTION...!IOTS has retested a good support zone in the daily chart and is preparing to reach the higher targets. *Please, be sure to enter after breaking the 0.091 resistance.* (The best entry can be after *retesting* the 0.091)

Longing iostusdt crypto pairiostusdt came to.my Poi and mitigated the valid ob on 4hr tf and I waited for my confirmation which I saw and I have place my order let see how it goes 🌚

IOST/USDT 24 Min Time Frame Bullish PopIOST/USDT 24 Min Time Frame looks like its going to pop any minute now. Pop to the upside.

IOST/USDT 1 Hour Time FrameIOST/USDT is looking bullish on the 15min, 24min, and 1 hour time frame. It looks like IOST wants to continue with the upward trend.

IOSTIt has reached a significant resistance, which due to the conditions of the Ichimoku cloud, will soon pass this resistance and can increase by 20% to 50% in the short term.
Due to the temporary drop in the price of Bitcoin (pullback), the closer the price is to the yellow areas, the more it can be bought.
The EOY target can be in the range of 12 to 13 cents.
Good luck...

IOST iost
proven itself already!
lets fly high!
easy tripple bagger!
x10 to come.
safe al! DCA!
Stone.

IOST has started a bullish way!IOST weekly time frame,
its appropriate for holding 6 months up to 1 year,
Patience is the key.

IOST - Bull Run Move - get readyIOST broke up the resistance line and is ready to go to explode. get ready for nice profit coming up in IOST.

Iost/Usdt update!!Iost probably will rise rapidly in the next few days, seeing that the movement is still above the support level.
Maybe for now going to correction before breakup
Hope you guys understand my chart..lol


IOST time to breakout, or get rejected?IOST broke level that this year was big support multiple times. Now right on it. This could be a turning point, will we see rejection and correction, or bounce back up? Any case is interesting for trading... Long or short, never mind. Volume is good, RSI has more space up before oversold, MACD looks like it could go down. We will have to wait and see... Set your alarms, it could be profitable...

IOTA Goes For itIOTA/USDT
My Preliminary Entry: .0418 on 8/25
Collected Gains Since Entry: 6.67%
Prognosis: IOTA rushes past TR-R (.0430) with demand surge as it eyes the first 1.0% Fibonacci target. Look for a possible retest of TR-R before further advancements.
*Fulltime Wyckoffian VSA crypto swing trader since 2017. I regularly seek out the most lucrative swings on all the major exchanges.
All my charts are clean, straightforward, and easy to follow. No junk, no needless indicators, just solid volume spread analysis ( VSA ) and 'take-the-money-and-run' Fibonacci target zones.
I go after the runners and big money. My win rates are between 80-85%. Follow me on TradingView and see for yourself.
I review over 300 coins & tokens daily and handpick all the runners myself (no bot signals).
** Not financial advice. Please trade at your own risk.

$IOST - where to next?A look at the current price action on IOST and showing entry criteria for bullish and bearish scenarios

iost to the moonhello every on
buy under 0.039
tp1 0.042
tp2 0.043
tp3 0.044
tp4 0.050
tp5 0.065
tp6 0.075
timezone 8h
not financil advice.

$IOSTTarget as shown in chart.
Thinking it will break ATH eventually.
Reclaimed resistance for now, looking good.
