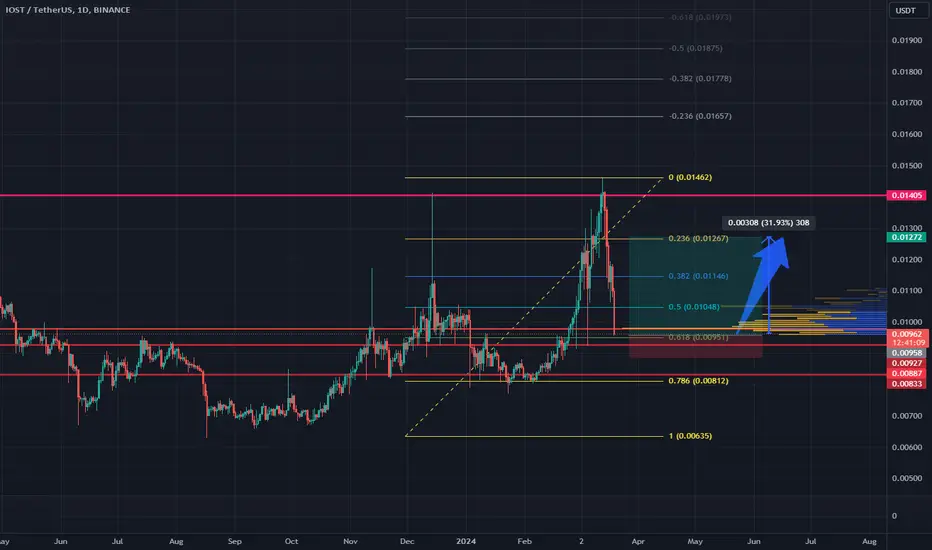
IOST WILL GAIN 5X MOREas u can see on the picture. i show u the buying area. so dont miss out to buy on the important areas for dca
IOSTUSDT trade ideas

IOSTUSDT gaining momentumEnF Breakout Strategy signaled BUY on IOSTUSDT
See idea for breakout entry, targets and stoploss
Only enter the trade when the price breaks above entry
Check out more on the script:
To get access to this script, DM me

Long-Term IOST sitting at 93% from ATH
Altcoin season soon
Following history when BTC moves Altcoins follow

IOST 20% shortIOST is likely entering into another distribution before making a potential bottom.
Another 20% drop is already planned imo.

IOSTUSDT 1DKeep an eye on #IOST. Buy it at the current price and on its support levels. In case of break out the falling wedge, the targets are:
$0.00920
$0.01023
$0.01107
$0.01190
$0.01309
$0.01460
Supports are:
$0.00818
$0.00753

LOST 4HThe price is approaching its clearing levels
Considering the compression in the price, we can expect price growth from the blue level.
blue level: 0.00828_0.00818
Target1: 0.00941
Target2: 0.00969
If you didn't get confirmation and we didn't see the demand in the price,
you are not allowed to enter

IOST easy 500% from here.IOST describes itself as an “ultra-fast,” fully fledged and decentralized blockchain network and ecosystem with its own nodes, wallets and based on the “next-generation” consensus protocol dubbed “proof-of-believability.”

IOST showing double bottom patterns on the monthly TF!IOST showing double bottom patterns on the monthly TF! 📉📈

scalp iostRemember to have entry orders in place to average this trade’s entry, and take 30% of profits in the first 2 Targets. After taking profits, move stops to entries or to breakeven levels. Keep in mind current market conditions and risk management.

$IOST Trading IdeaIOST/USD is currently consolidating within this accumulation horizontal channel. Expect a full send after a breakout. We need to overcome this resistance zone and close above it. My potential targets following this breakout are: $0.01906; $0.02777; $0.03776; $0.05385.

IOST/USDT I BUY SETUP✔︎📈 BINANCE:IOSTUSDT SIGNAL
✔︎ENTRY : 0.01093
🏓TARGETS :
✔︎ T1 : 0.01202
✔︎ T2 : 0.01311
✔︎ T3 : 0.01446
✘ STOP : 0.01019
🚦Stop Trigger:
• If you make capital management: Stop is activated when one candle opening and closing
below the stop level of the same time frame of the signal.
• If you don't make capital management: Stop is direct without waiting for the candle to close.
💡Risk management :
• Enter the trade with 10% to 20% of your capital to reduce risk and save cash to enter other opportunities.
• Sell (25% to 50%) on (T1) and don't move your stop-loss.
• Sell 50% on (T2) and move your stop loss to the entry point.
• You are safe now, and the next 25% is up to you.
💡Reason for this trade:
This trade gives my trading system a sign of strength:
• My trading system is based on liquidity and reversal zones.
• When the liquidity is swept from one side under certain conditions, we will wait for the price on the other side.
The liquidity will attract the price like a magnet.
• the first side that has been swept:
1- failure swing point
2- range low
• Opposite side targets:
1- liquidity void
2- inducment
💡Entry setup
1- successful auction (AMT)
retest voume profile POC after failuer swing point
⚠️WARNING:
• I'm not a financial advisor.
• Do your own research (DYOR).

IOSTUSD is in good mood for reatracement in 4hIOSTUSD is in good mood fo reatracement in 4h time frame

IOST RECLAIMS LEVEL#IOST has made a higher low off a very clear bottoming formation after breaking out of a Descending Channel(BullFlag)!
I expect to see IOST to make its way towards the Golden Pocket @ $0.035 and possibly much higher!

IOST is ready to make a move.It has rarely move since the BTC broke out.
The next rally will be for IOST.

iost | iostusdt idea - b/s live all green iost | iostusdt idea - b/s live all green
Keep trying play button , the moment b/s and xds live data all green , it will remain bullish

iostIn the weekly time, I consider a good growth for it, and usually a 5-wave can grow up to the high targets.

IOST Bottom Fractals IOST PA exhibiting an interesting pattern when bottom. Chart speaks and so we listen!
The bottom pattern is slightly smaller or less volatile than the last, which I believe is a sign of maturity (less manipulation).
It's true that 5 is slightly more pronounced in the previous bottom but again most likely due to manipulation. So we can disregard the long wicks. Other than that it's an exact replica of the PA.
Cheers

IOST/USDT Ready to Rally from a Perfect Position? IOST Analysis 💎Attention Paradisers! #IOSTUSDT is making significant strides, currently challenging a crucial resistance within an ascending channel. Maintaining this trajectory could propel a bullish breakout, aiming for an initial resistance at $0.1439, before setting sights on even loftier resistances.
💎If #IOST begins to lose steam at this resistance, anticipate a bullish recovery from substantial support at $0.0103—a zone celebrated for its liquidity, marked by previous intense upward movements and striking green candles for $IOST.
💎A breach below this critical support may indicate a pivot toward a bearish trend, characterized by a surge in selling activities. Staying vigilant and ready to adapt is crucial as we traverse the dynamic #IOST market landscape.

IOSTUSDT 5DIOST ~ 5D 📈
#IOST Make purchases gradually, After breaking through this resistance line, with a Target of at least 20%++ from here. 🔼


202304 - IOST W chart > Breakout > PumpIOST breakout resistance zone, time to fly now.
Expect target 20-30-50%

#IOST/USDT#IOST
We have a down channel that has just been broken very nicely
We have a strong rising trend on RSI as well
We have a higher stability than the Moving Average 100 and we have an upward discount
The pattern is canceled if the day is closed with a strong bearish candle below the green support area
Entry price is 0.00943
The first target is 0.00970
The second goal is 0.01015
The third goal is 0.01071
