IOSTUSDT trade ideas

IOSTUSDT 50% GrowthHello Traders!
IOSTUSDT Investment grows to 50%.
I am expecting 150% of the Investment in IOSTUSDT.
IOST Signal

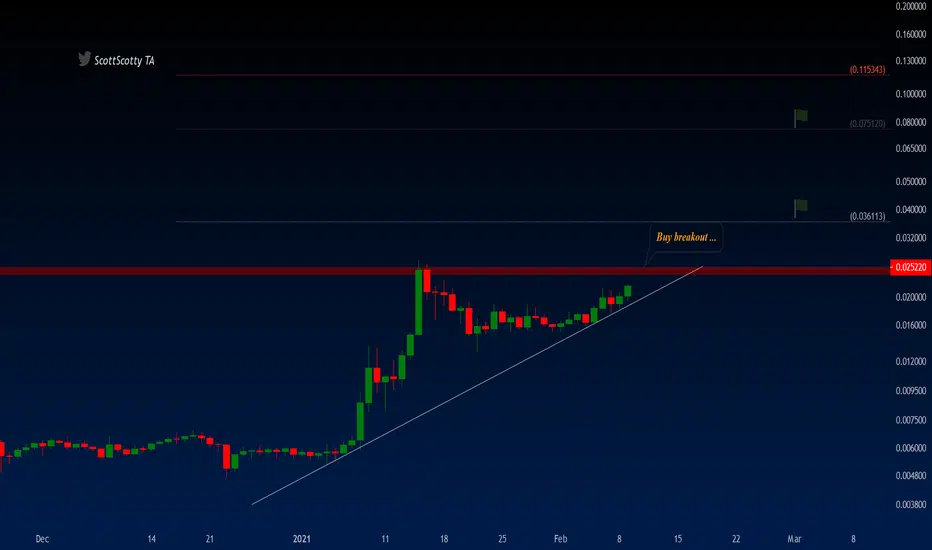
IOSTUSDTTrading within a bullish channel since the 10th of Feb with multiple touches of the lower trend line, price has broken the upper trendline which signals possible further bullish movements


Crypto|IOST/USDT|LongLong IOST/USDT
Activation of the transaction only when the blue zone is fixed/broken.
The idea is to work out the resistance level .
* Possible closing of a trade before reaching the take/stop zone. The author can close the deal for subjective reasons, this does not completely cancel the idea and is not a call to the same action, you can continue working out the idea according to your data, but without the support of the author.
+ Maybe right now we will go even lower, then it's okay, the idea is not activated and simply canceled.
The "forecast" tool is used for more noticeable display of % (for the place of the usual % scale) of the price change, I do not put the date and time of the transaction, only %.
Blue zones - activation zones.
Green zones - take zones.
The red zone - stop zone.
Working out the stop when the price returns to the level after activation + fixing in the red zone.
Orange arrow - the direction of take.
Blue arrow - neutral scenario without activating the trade.
The red arrow - the direction of the stop.
SUM PNL: This parameter displays the total % of all closed ideas of the "new" format (according to the author) for this sector at the time of publication of the idea. The calculation is very "clumsy" just the sum of the profits of all the ideas, based on this indicator, you can more accurately assess the risks when working with my ideas of this sector. I present you the construction of the idea, you can use it yourself as you like based on your subjective view and risks, the calculation of the PNL indicator is carried out only on transactions that the author closed on TV in manual mode or by take.
P.S Please use RM (risk management) and MM (money management) if you decide to use my ideas, there will always be unprofitable ideas, this will definitely happen, the goal of the system is that there will be more profitable ideas at a distance.

IOSTUSD 150% TargetHello Traders!
It is currently in the J curve. It looks like IOSTUSDT is going to speed up soon.
Target is 2 times the size of j's curve.
It will give more than 150% of the investment.

IOST/USDT SEND IT 🚀Hey hey my friends!
Just buy it, bullish everything, even Chinese adoption news!
Bounce from the 200EMA
Break through the 50 and the 21 with volume 🧨
Enjoy 🍿

IOSTUSDT entry: around 0.0222
TP1: 0.02677
TP2: 0.0298
TP3: 0.03259
TP4: 0.03537
SL: 0.017419
Check my website for tutorials, examples and calls :)
cry-pto-surf.com


Iostusdt trading opportunityHello guys,
IOST painted clean ISHS with price already breakout and holding firm above the neckline with massive rally, looking closely on this we can see we still have more room on the upside to complete the pattern target.
Kindly follow the suggested BUY zone on the chart and always remember to apply stop loss according to the chart and your personal set risk management.
Level to watch for are:
POSSIBLE ENTRY ZONE
Possible Support LEVEL
SELL TARGETS
Kindly go through the chart and leave us your comments with your likes and also follow us for more trading updates.
Thank you.
Note:
It will be good to always understand risk involve in trading. Always trade with stop Loss in place.
Set up an entry/exit strategy for every trade, with good risk/reward ratio.

🔥 IOST Bullish Price ActionOver the last week or so, IOST has been showing moderate bullish price action: higher highs and higher lows. A lot of cryptos are seeing double digit growth on a daily basis, but not IOST... for now. The last time IOST actually mooned was almost a month ago. Currently, it's showing signs of a potential future break out, starting with a couple of fays of moderate growth. This trade is based around that future break out.
On the chart I’ve marked two potential areas of resistance, R1 and R2. These areas are based on recent swing highs and round numbers. Do your own due diligence.
Happy trading!

IOSTUSDT is creating a bullflag 🦐$IOST.X is testing the weekly resistance inside a nice bullflag. If the price will have a breakout upward, According to Plancton's strategy (check our Academy), we can set a nice order
–––––
Follow the Shrimp 🦐
Keep in mind.
🟣 Purple structure -> Monthly structure.
🔴 Red structure -> Weekly structure.
🔵 Blue structure -> Daily structure.
🟡 Yellow structure -> 4h structure.
⚫️ Black structure -> <4h structure.
Here is the Plancton0618 technical analysis, please comment below if you have any question.
The ENTRY in the market will be taken only if the condition of the Plancton0618 strategy will trigger.


IOST, 5x Gains LoadingWarning: our thoughts are ours; not financial advice.
In our opinion, IOST could move from 1 cent to 5 cents with ease. That should take it to the top of the channel before cooling off. It's also possible we see a breakout to the top of the channel.
Nothing is certain in the market. Only trade with what you can afford to lose.


IOSTUSDT - Bullish continuation?To keep myself accountable and keep practicing my TA I'll be charting the top 100 crypto's by marketcap over the coming fews days. Any feedback and tips are welcome.
Trend = neutral/bullish. Just had a MSB (LH after HH) that formed a bit of a wedge.
Broken out to the upside now.
Needs to break previous swing high to gain full bull momentum again.
HL are confirming this, decent volume
Notes:
- Did not drop a lot after the BTC run to 40k, showing strength (might be because USDT pairing)
- 'Wedge' broken upwards, looking bullish
Ideas:
- Close above W1/previous swing high would be good spot to pick some up, if volume remains high
