IOTA/USD - you shouldn't buy under a moving average.you shouldn't buy under a moving average.
buy at this level
waiting for movement from Bitcoin and the other ALTs.
IOTAUSD trade ideas

THE ULTIMATE LONG TERM IOTA ANALYSIS | WYCKOFF METHOD. Hello Guys, that's an ultimate Analysis based on Wyckoff method.
Is a new crypto bull run coming?
For those who don't know about Wyckoff: He applied a unique charting technique to estimate the potential effects of a cause. So, he created methods of defining trading targets based on the periods of accumulation and distribution. This allowed him to estimate the probable extension of a market trend after breaking out of a consolidation zone or trading range.
I'm gonna explain briefly these different stages:
PHASE A
(PS) The Preliminary Support indicates that some buyers are showing up, but still not enough to stop the downward move.
In this post, I not recommend buying or selling for anyone, this is just a analysis depend on Wyckoff method.
The Selling Climax (SC) is formed by an intense selling activity as investors capitulate. The strong drop quickly reverts into a bounce or Automatic Rally (AR) , as the excessive supply is absorbed by the buyers. In general, the trading range (TR) of an Accumulation Schematic is defined by the space between the SC low and the AR high.
PHASE B is the consolidation stage, in which the Composite Man accumulates the highest number of assets.
PHASE C - Where we are now!
The Spring, often breaks the support levels to stop out traders and mislead investors. We may describe it as a final attempt to buy shares at a lower price before the uptrend starts. The bear trap induces retail investors to give up their holdings.
The last two phases:
PHASE D
The Phase D represents the transition between the Cause and Effect. It stands between the Accumulation zone (Phase C) and the breakout of the trading range (Phase E).
PHACE E
The Phase E is the last stage of an Accumulation Schematic. It is marked by an evident breakout of the trading range, caused by increased market demand. This is when the trading range is effectively broken, and the uptrend starts.
Tap a LIKE if you think is a useful idea and comment below!
In this post, I not recommend buying or selling, that's my consideration based on Wyckoff method. So do your own research and follow your trading plan with a properly Money Management.
Thank you for reading.

Looking for a few more days of accumulation; Bullish attitude I am no expert; But when world markets are acting the way they are i think we have a lot to look forward to when it comes to FREE AND FEE LESS transactions and the IOT economy is being built with IOTA like concepts. Feeling bullish in a bearish suit.

Take it for what it is Going Long Just a few Overlays with current markets my -8% buy orders got filled . #IOTA has a bright future still going long and DCA till the stage is set.

IOTA LONG | TARGET DLY 0.38 FIBO LEVELThis is a Price Action Analysis.
As you can see Iota react to the Buy Area (Key Level - Previously Resistance become a Support)
STOP LOSS 12.20
TAKE PROFIT AREA - DAILY FIBO LEVEL 0.38.
Risk Reward Ratio can be 4 times bigger.
Tap a LIKE if you think is a useful idea and comment below!
Please do your own research, and follow your trading plan with a properly Money Management.

Three rising valleys patternA new pattern - Three rising valleys - is possible.
The potential profit is more than 40%.
Targets on the chart.

IOTA/USD - The triangle has not yet been fully worked out.The triangle has not yet been fully worked out.
the breakdown and the test was, and now I'm waiting for the next movement...
I'll put 1% of the deposit into the deal.
Friends, thanks for your likes and comments!
Good luck with trading!


IOTA USD price forecast
IOTA USD is today's traded at a price 0.15 USD - in the Europe/London timezone. IOTA USD price forecast for the next period. Price change over the last 24 hours is (-13.81%), which is exactly -0.02 $. Today's trading day the IOTA USD price starts on the level 0.17 $, with the highest price today 0.18 $ and the lowest price reached 0.14 $ level. If we look at the overall development of the price over the last few months, the lowest price was at 0.08 $ and reached the highest levels at 0.56 $. We can see that the price of IOTA USD has fluctuated in the last period about 0.08 - 0.56 $ levels.


IOTAUSD - 1 HOUR 1 hour chart: We can draw a symmetrical triangle, this triangle occurred after a bull move, this is mostly consolidation before continuing the uptrend. We are currently at resistance and need to wait for a clear break above the trendline. It is also possible that we fall back down at support of the triangle but the price range is getting tight.

IOTA extinction I look at the chart and what I see? An exponentially decaying price, down 97.5% of its ATH. I pity the poor souls who bought the top.
What else? It fell under its bottom longterm trendline and now it is just testing it. My god this coin is so dead, I won't be surprised if they shut down its network tomorrow...oh wait.

IOTA next support at 0.00237a 100% drop. If you don't understand technical analysis, let me explain a simple concept called break of support. If you have a support that is 1 year long like the blue line and you break under it, retest it and fail, it is a very very very bad sign.

IOTAGaussian channel donger has formed, this is present across a wide range of crypto currencies, intentional? I hope not. A falling wedge can be seen to have also formed which has led to a climb back into the channel, this may lead to more upsides for the coin. Quite funny actually..

Still going LongCheck my previous post from January 22nd, Still looking those longs. Go IOTA "Watch this space"

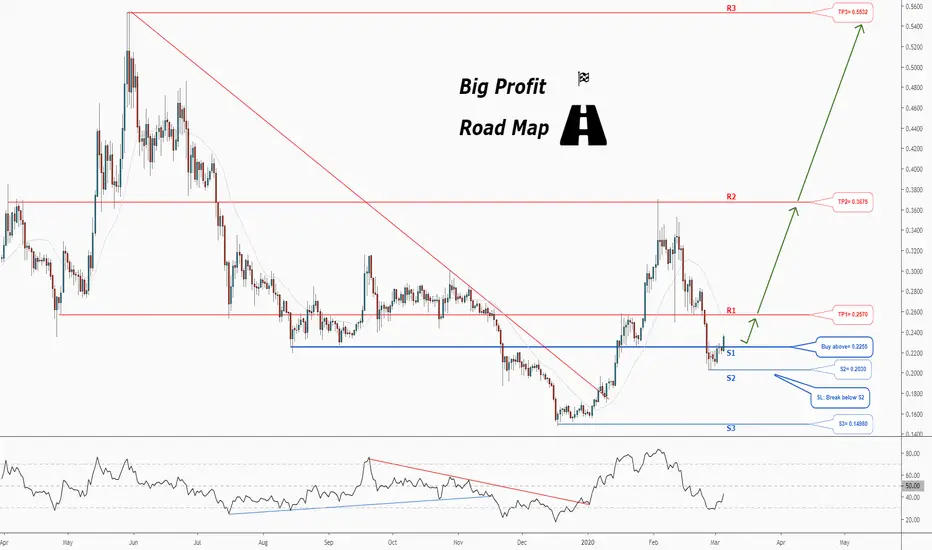
Don't miss the great buy opportunity in IOTUSDTrading suggestion:
. There is a possibility of temporary retracement to suggested support line (0.2255). if so, traders can set orders based on Price Action and expect to reach short-term targets.
Technical analysis:
. IOTUSD is in a range bound and the beginning of uptrend is expected.
.The price is above the 21-Day WEMA which acts as a dynamic support.
. The RSI is at 43.
Take Profits:
TP1= @ 0.2570
TP2= @ 0.3675
TP3= @ 0.5532
SL= Break below S2
IOTAUSD - Resistance !Good evening all!
I will share my thoughts of the current market situation and any possible targets. You can make your conclusion out of this and make your own decision how to play it!
Already 3 times the 26 EMA is acting as resistance, currently we are testing it again! This area is aligning with the upper trendline of the falling wedge pattern.
Can we break resistance and continue upwards?
Next target; give this idea a like and me a follow : ))))
Thanks for your support !
Remember ; Every Moment Is Unique !

IOTA’s mainnet is “not operational”The IOTA network has been down for approximately 11 days and the IOTA Foundation doesn’t expect the mainnet to be reactivated until March 2.
ATR ALERT HOLDING THE TREND SHORT FOR NOW

BUY: IOT/USD (Systematic Trend Following)## OUR APPROACH:
- 100% Systematic Trend Following Trading
- Trading Long and Short Signals with a medium-term time frame to capture +50% price moves
- Always protect your position with a stop loss (initial stop loss turns into trailing stop loss)
## TRADING LONG SIGNALS:
- Go long as the price closes above the "orange" solid Channel Line
- The "purple" dotted line always shows your current stop loss (it is trailing)
- Ride the trend as the price moves up
- Exit the position only if the price closes below the trailing stop loss
##TRADING SHORT SIGNALS:
- Go short as the price closes below the "orange" solid Channel Line
- The "purple" dotted line always shows your current stop loss (it is trailing)
- Ride the trend as the price moves down
- Exit the position only if the price closes above the trailing stop loss
##WANT TO APPLY THIS SYSTEM TO YOUR TRADING?
- Reach out to us via the message function on Tradingview to get access to this Pine Script on Tradingview
## OUR TRADING SETUP (Hit the links below to sign up for the services we love!)
Data and Charts by Tradingview:
tradingview.go2cloud.org
Trading on Binance:
www.binance.com
Trading on Bitfinex:
www.bitfinex.com
## OUR FAVORITE BOOKS
Trend Following Trading – How to make a fortune in Bull, Bear and Black Swan Markets
amzn.to
Trend Commandments – Trading for Exceptional Returns
amzn.to
The Rule – How I beat the odds in the markets and in life – And how you can too
amzn.to
Market Wizards – Interviews with Top Traders
amzn.to


IOTAUSD - Move itI saw it happen many times before. break of the trend line, a bit of sideways action, perhaps a retest of the broken trend line and continuation.
Will this time be different?
