IOTUSD: Trend Reversal and the Perfect Trade How should the perfect buy opportunity look like, if we talk about a trend reversal?
Here is an example for you that can be used with any timeframe and in any market.
We have a local downtrend, which is a correction of the main uptrend in the higher timeframe.
The price reached the support zone and bounced form it several times. It tells us that the support zone is strong, and it can reverse the market.
Indicators confirm the price reversal and a possible upward movement.
The market gives us a trend reversal signal based on a bullish divergence. If the price breaks the local downtrend line, it will confirm the trend reversal. We have a strong buy signal based on the trend reversal signal.
Entry Price: above 0.2750
Stop Level: below 0.2530
Profit Level: at 0.3480
Risk per trade must be no more than 10% of your capital.
It is an example of how we can use the buy opportunity.
Don't forget that in our case, Bitcoin can change the whole situation in this market and push the price below the support. That's why the proper risk and money management must be involved in trading.
Disclaimer!
This post does not provide financial advice. It is for educational purposes only! You can use the information from the post to make your own trading plan for the market. But you must do your own research and use it as the priority. Trading is risky, and it is not suitable for everyone. Only you can be responsible for your trading.
IOTAUSD trade ideas


IOTA/USDT time to do nothingHello traders,
I see two scenarios for IOTA/DOLLAR, we are inside a downtrend channel.
We are close to an important level of support level that can hold the price and retesting the resistance line, and we may be moving sideways or breaking the line in uptrend moviment, and the second scenario is the price test that the support line of this downtrend channel
I only buy this asset close to the support line of the downtrend channel, or above the long term resistance line.
Now is time to do nothing in IOTA, only watch the price reactions at thoses points.
Please support this publication with your like. You are welcome to follow us on the Tradingview.
Best regard Sandro and Gustavo.

IOTUSD: Good Buy OpportunityThe market looks interesting for buying in the long run. We have the price reversal confirmed by RSI, MACD, and a reversal candlestick pattern. If Bitcoin keeps the upward movement, this market will be able to reach the important highs at 0.3500 and 0.5500 levels. It makes this buy opportunity very interesting as we have enough space for the upward movement.
Disclaimer!
This post does not provide financial advice. It is for educational purposes only! You can use the information from the post to make your own trading plan for the market. But you must do your own research and use it as the priority. Trading is risky, and it is not suitable for everyone. Only you can be responsible for your trading.


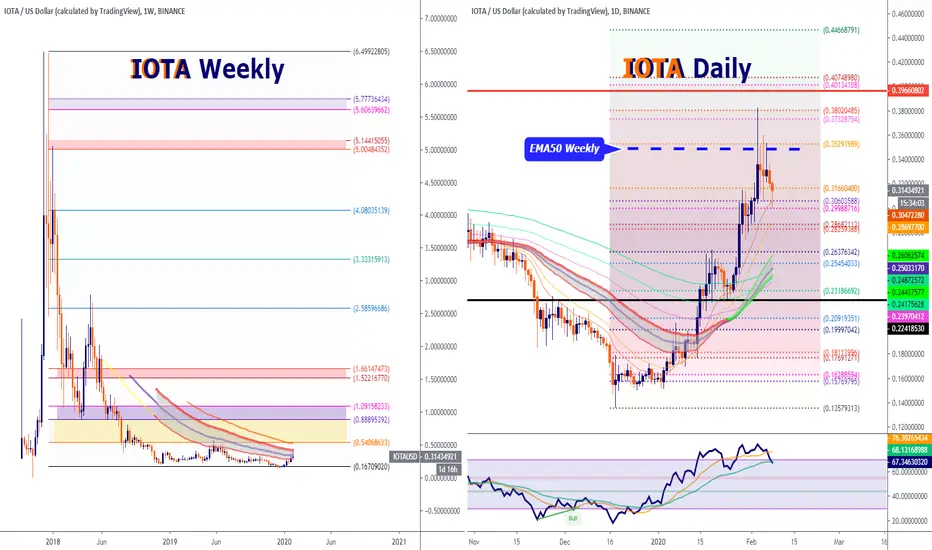
IOTA struggling around EMA 50 (Weekly)IOTA/USD Weekly & Daily Chart.
Disclaimer:
We are not registered or licensed in any jurisdiction whatsoever to provide investing advice or anything of an advisory or consultancy nature,
and are therefore are unqualified to give investment recommendations.
Always do your own research and consult with a licensed investment professional before investing.
This communication is never to be used as the basis of making investment decisions, and it is for entertainment purposes only.
IOTUSD Has a Bearish Wolfe Wave PatternIOTUSD Has a Bearish Wolfe Wave Pattern. If price breakouts the wolfe wave line, price may continue to fall down.

"Endings to be useful must be inconclusive."Imagine getting the same result with less than half the effort/volume out of one single shitcoin.
Well you don't have to because they made it real.
This idea was brought to you by the IOTA foundation and your favourite boiler boards, possibly, maybe.
Please remain seated and hold on to your bags until the plane has come to a full crash.
(Again, this is satire and should not be taken seriously.)

How to trade a triangle breakout using Elliot Wave Principle. Triangles provide great opportunities when it comes to solid trade setups. Such a setup presented itself in the IOTA market. There are ways to properly trade these setups with correct risk reward levels and without increased stress levels.
I have just recorded a 10 min video on how to do it , so pls check the YT link below the chart for advanced explanations.


IOTUSD Heavy bullish sentimentIOT has broken above the 1D Channel Up that started the strong uptrend early in January.
Levels to watch:
- The price not only crossed above the Channel Up on the 1D chart but also broke the 0.618 Fibonacci retracement level.
- It is comfortably above both the MA50 and MA200 and in fact a Golden Cross may be due.
- The 0.3150 four month Resistance broke.
- The RSI on the highest values since December 2017.
Projection:
- This is a strong bullish signal with IOT potentially turning parabolic here. The targets are the next Fibonacci retracement levels: 0.786 = 0.4200 and 1.000 = 0.5580.
If you like this idea give us a like, follow and share your thoughts in the comments section below. Remember to stay tuned for future technical analysis , news, updates, and more from PrimeXBT!


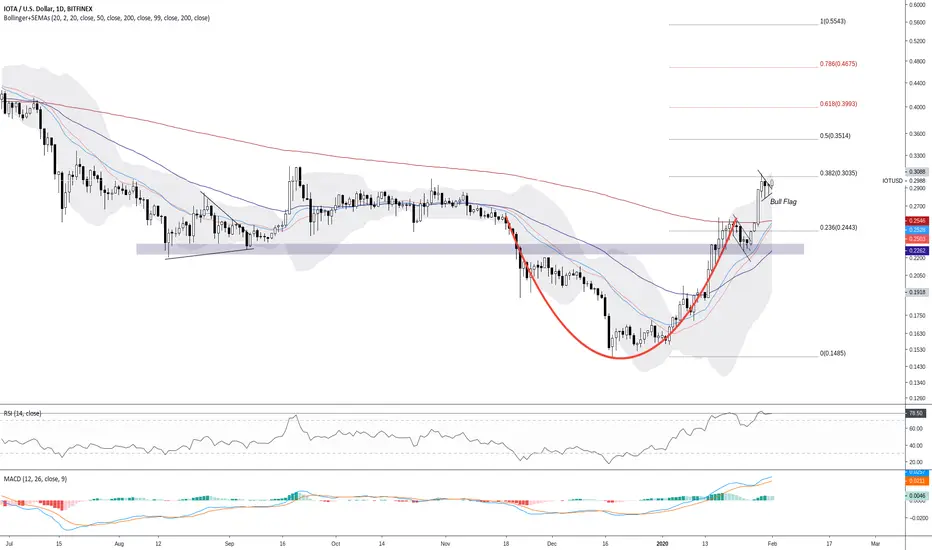
IOTUSDHey Friends, here my Analysis to IOTUSD. Bull Flag in the Daily Chart. (all Information in the Chart)
*Just my opinion no financial advice.*


IOTA still at +65024% ROI and up 100% in 2020Iota is up 100% this year, but in a brutal downtrend since its binance listing.
Iota has great fundamentals but hype and a misinterpreted microsoft partnership pumped the price to unhealthy levels.
One of the important points to determine iotas potential future lows is the all time ROI and iota is up +1278% since its ico which is the second most successful ico after nxt.
Since the iota tokens sold at a really low price at its ico the low term correction still has alot of downward pressure.
TLDR: Great fundamentals but still highly overvalued at +65024% ROI. And always made a new low after a 100% upside push.
No financial advise!

IOTA USD Long I feel like we are building excelent levels and maintaining those levels of support while rising. I am currently looking to open a long position if we drop back down around .21 or .22

IOTA Prints Weekly Buy Signal Over the next several weeks/months I expect the price per miota to accelerate towards the $0.40-$0.50 range


There is a possibility for the beginning of an uptrend in IOTUSDTechnical analysis:
. IOTA/DOLLAR is in a range bound and the beginning of uptrend is expected.
.The price is above the 21-Day WEMA which acts as a dynamic support.
. The RSI is at 70.
Trading suggestion:
. There is a possibility of temporary retracement to suggested support zone (0.2215 to 0.1895). if so, traders can set orders based on Price Action and expect to reach short-term targets.
Beginning of entry zone (0.2215)
Ending of entry zone (0.1895)
Entry signal:
Signal to enter the market occurs when the price comes to " Buy zone " then forms one of the reversal patterns, whether " Bullish Engulfing ", " Hammer " or " Valley " in other words, NO entry signal when the price comes to the zone BUT after any of reversal patterns is formed in the zone. To learn more about " Entry signal " and the special version of our " Price Action " strategy FOLLOW our lessons :
Take Profits:
TP1= @ 0.2880
TP2= @ 0.3510
TP3= @ 0.4535
TP4= @ 0.5550
TP5= @ 0.7450
TP6= @ 1.1145
TP7= @ 1.4130
TP8= @ 1.7110
TP9= @ 2.1945
TP10= @ 2.6775
TP11= Free

IOTUSDHey Friends, here my Analysis to IOTA. (all Information in the Chart)
Just my opinion no financial advice.
