IOTUSD has completed the bullish setup | Upto 1052% profitThe IOTUSD was moving within a descending triangle and left the triangle without breakout or breakdown.
Since july 2017 the price action has found a strong support of $0.2051 and this support is not broken sofar.
The bollinger bands is extreme squeeze which is an indication of a massive move up or down soon.
MACD gave weak bull signals since sep 2018 and now it is strong bullish since aptil 2019.
After the death cross of jun 2018 the 10SMA is making golden cross with 20SMA and both moving averages has crossed down the priceline as well to lift the price action up insha Allah.
The sell targets are:
1st target: $2.26
2nd target: $2.90
3rd target: $3.72
Final targets;$ 4.68
Regards,
Atif Akbar (moon333)
IOTAUSD trade ideas

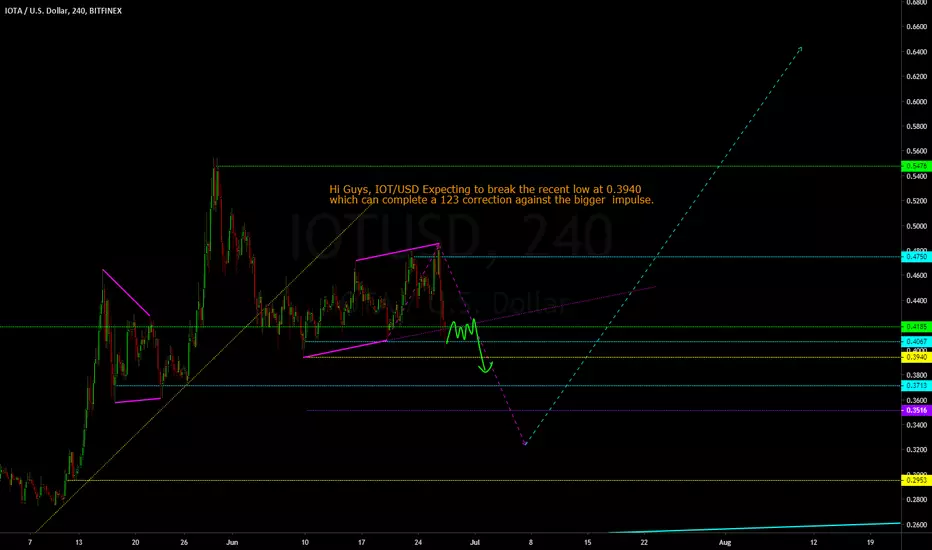
IOT/USD expecting continuation for the down move Hi Guys, IOT/USD Expecting to break the recent low at 0.3940
which can complete a 123 correction against the bigger impulse.
Testing IOTAUSD resistance areaIOTA is testing it's resistance zone, it bounced of off the middle of this zone. Watch for succesful retrys.


IOTUSD long due for a retracementIOTUSD seems long due for a retracement. With BTC and LTC being more bullish lately, this could rise fast.


A second Chance to Buy in IOTAUSDMidterm forecast:
0.4015 is a major support, while this level is not broken, the Midterm wave will be uptrend.
Technical analysis:
Price is above WEMA21, if price drops more, this line can act as dynamic support against more losses.
Relative strength index ( RSI ) is 55.
New trading suggestion:
*There is still a possibility of temporary retracement to suggested support line (0.4015). if so, traders can set orders based on Price Action and expect to reach short-term targets.
*If you missed our first HUNT, you have a second chance to buy above the suggested support line (0.4015).
Entry signal:
Signal to enter the market occurs when the price comes to "Support line" then forms one of the reversal patterns, whether "Bullish Engulfing", "Hammer" or "Valley", in other words,
NO entry signal when the price comes to the zone BUT after any of reversal patterns is formed in the zone.
To learn more about "Entry signal" and special version of our "Price Action" strategy FOLLOW our lessons:
Trade Setup:
We opened 15 BUY trade(s) @ 0.3196 based on 'Valley' entry method at 2019.04.29.
Total Profit: 19315 pip
Closed trade(s): 4366 pip Profit
Open trade(s): 14949 149pip Profit
Closed Profit:
TP1 @ 0.3340 touched at 2019.05.13 with 144 pip Profit.
TP2 @ 0.4015 touched at 2019.05.15 with 819 pip Profit.
TP3 @ 0.4535 touched at 2019.05.16 with 1339 pip Profit.
TP4 @ 0.5260 touched at 2019.05.29 with 2064 pip Profit.
144 + 819 + 1339 + 2064 = 4366
Open Profit:
Profit for one trade is 0.4555 (current price) - 0.3196 (open price) = 1359 pip
11 trade(s) still open, therefore total profit for open trade(s) is 1359 x 11 = 14949 pip
All SLs moved to Break-even point.
Take Profits:
TP5= @ 0.6105
TP6= @ 0.7920
TP7= @ 0.9265
TP8= @ 1.1550
TP9= @ 1.4475
TP10= @ 1.7435
TP11= @ 2.2170
TP12= @ 2.6930
TP13= @ 3.3680
TP14= @ 4.2300
TP15= Free

IOTA - Good low-risk trade for mid-long term holdClear and simple chart. Good RR. Trade at your own risk, this is my personal trade.


IOTA EntryWelcome Back!
I haven't posted any entries for a while so i figured I would give it another shot.
IOTA is setting up for a simple buy set up with a projected gains of 75%.
Entry: 0.288
Exit: 0.5
Will update as trade progresses

IOTA test HEAD & SHOULDER PATTERNThe IOTA is testing great Head & shoulders now. If it break 0.3929$ then fall down to 0.3503 so 2nd tp can be 0.2948$ based on Fibonacci.

Iota is working for the bullish pattern !!Hey guys, Iota is not ready yet to go to the sky, you need to wait for the pattern to be completed, this could take days so be patience!!! Keep you updated!!!


Downstream channel and triangleIOTA is steady on a downstream channel but is now approaching a bullish trendline that corrected it.
The motion shown is a channel that is being broken with the formation of a triangle.
If the currency breaks up is kind of operation is high risk because it is going against the primary trend, which is high. However it is possible to make good profits, since we wait a pullback


IOTA swing tradeIOTA has given confirmation in USD pair but 50 weekly MA is acting as a resistance. Confirmation in btc pair has not been established. Waiting for confirmation.
Meanwhile look for stability in the BTC pair around this green zone. Entering on 7 Weekly EMA on USD pair is recommended. Break below 21 EMA (either USD and BTC) on weekly invalidates this setup.

#hodl Iota IOTUSD to 1$ first Take Profit.Very good news in this ecosystem, partnerships with big company's & good news revealing this next quarter. Hodl is about patience. Buying in correct places and store your tokens in safe spaces like a hardware wallet is more professional and you are gonna hodl it more time. If you like my content give this post a thumbs up.
Technical Analysis
Buy in the yellow zone for massive accumulation. 0.30 cents is a very good price.
Don´t go to daily and 4H time frame just focus on weekly & monthly charts in altcoins.
We can have a retest of the trend line.
Namaste.

IOTA bullish asymmetrical triangle. PT of 0.6. #IOTAUSDVolume supports the asymmetrical triangle pattern. Just in time for Monday.
- upwards


4ª onda/wave?No gráfico diário do IOT identificamos a formação da quarta onda Elliott. Após o movimento dessa quarta onda, temos uma possível quinta onda que nos levará ao rompimento da atual resistência. Então ficaremos atento e caso a quarta onda se confirme (através de um suporte na região demarcada), estaremos em uma região de compras.
In the daily chart of the IOT we identified the formation of the fourth wave Elliott. After the movement of this fourth wave, we have a possible fifth wave that will lead us to the breaking of the current resistance. Then we will be attentive and if the fourth wave is confirmed (through a support in the demarcated region), we will be in a shopping region.
