Iota Building Up For Breakout Seems Like Already Bottomed Out And Looks Ready For Massive recovery
Formed Falling Wedge In Higher Timeframes Incase Of breakout expecting 220 to 240% Bullish Move
IOTAUSDT trade ideas

Crypto IOTA. TF H4 LONG (limit order)According to calculations, the trend started on the four-hour timeframe on March 10. Today, March 14, the level of 0.2236 was tested.
In the near future this level will be tested again.
Take profit is set at 0.2353 , with a very high probability we will get profit.
I think that we can enter the trade by placing limit buy order from the level of 0.2017 . But do not forget about SL = 0.1760
Good luck!

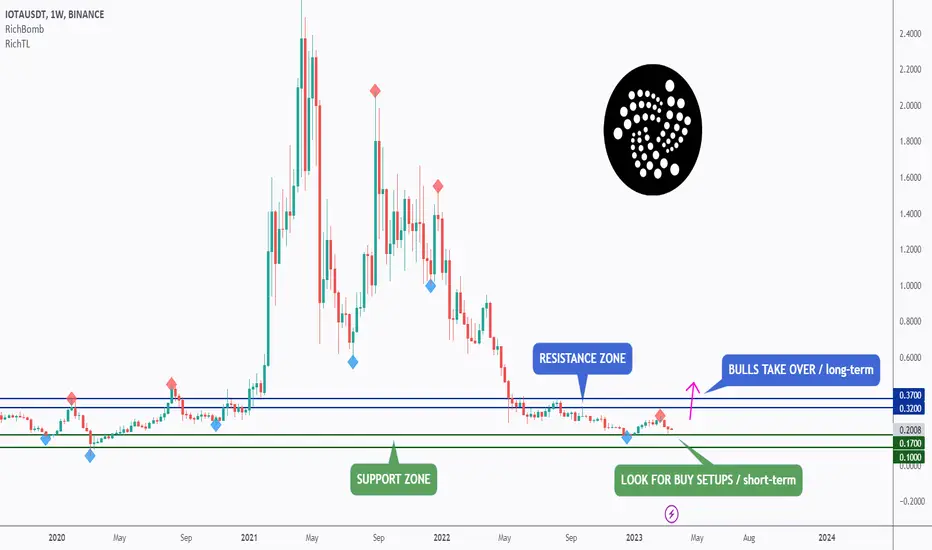
IOTA Long-Term View 🔎 Analysis #16/50Hello TradingView Family / Fellow Traders. This is Richard, also known as theSignalyst.
IOTA has been stuck inside a big range between the 0.2 support and 0.4 resistance.
🏹 Now IOTA is approaching the lower bound / support zone so we will be looking for buy setups on lower timeframes
For the bulls to take over long-term , we need a weekly candle close above 0.370
📚 Always follow your trading plan regarding entry, risk management, and trade management.
Good luck!
All Strategies Are Good; If Managed Properly!
~Rich
IOTAUSDT Elliott Waves AnalysisHello friends.
Please support my work by clicking the LIKE button👍(If you liked). Also i will appreciate for ur activity. Thank you!
Everything on the chart.
Entry: market and lower
Targets: 0.28 - 0.33 - 0.36
after first target reached move ur stop to breakeven
Stop: ~0.155 (depending of ur risk). ALWAYS follow ur RM .
RR: 1 to 3
risk is justified
Good luck everyone!
Follow me on TRADINGView, if you don't want to miss my next analysis or signals.
It's not financial advice.
Dont Forget, always make your own research before to trade my ideas!
Open to any questions and suggestions

MIOTA shortMIOTA broke trough off the lower boundary of ascending channel. Asset broke trough the support level. Bearish movement to support level at 0.186 is expected to happen.

IOTAUSDT needs more Liquidity?IOTAUSDThad a false breakout from its daily resistance level and is currently consolidating below it.
The market is creating a pennant, which is a common technical chart pattern that can indicate a potential continuation or reversal of the current trend.
Traders who follow technical analysis may be watching for a breakout from the pennant pattern to signal the direction of the next price move. However, it is important to note that false breakouts can occur and may lead to significant losses if traders are not careful.
In addition, traders should also be aware of the potential for a false breakout on the previous support level. If the price breaks below the support level but quickly rebounds back above it, this could be a false breakout and may lead to further consolidation or a potential reversal of the current trend.
–––––
Follow the Shrimp 🦐
Keep in mind.
🟣 Purple structure -> Monthly structure.
🔴 Red structure -> Weekly structure.
🔵 Blue structure -> Daily structure.
🟡 Yellow structure -> 4h structure.
⚫️ Black structure -> <= 1h structure.
Follow the Shrimp 🦐

IOTA FALLING WEDGE PATTERNIOTA broke out falling wedge pattern on 1 week time frame
loading some bags here
DYOR

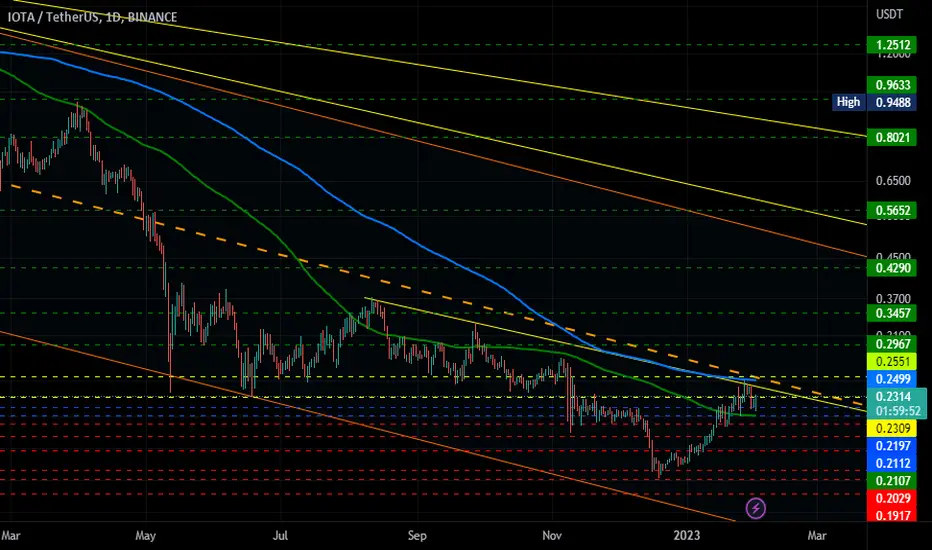
IOTAUSDTYou can see the 1-day chart of IOTA/USDT. After going through an upward wave, the price produced a correction for 1 month in the range of 0.20 to 0.25, and in recent days, attempts have been made to escape from this price range, which coincides with the breaking of the 200 average. Fast. Also, the price is crossing its long-term static resistance in the range of 0.25, which shows the formation of downstream patterns as well as the persistence and accumulation of the possibility of exiting this range. In my opinion, as an oscillator, we will continue to see an increase up to the range of 0.40, as the target of the measured patterns is also aimed at this price range. My suggestion is to buy in the range of 0.25 to 0.21 with capital management and in the form of a staircase and limit loss. Giving the range of 0.19 and target areas of 0.4 is to swing friends. At the same time, risk-taking friends can use a narrower loss limit. The overall goal was to show the potential for growth, and friends should optimize the entry and exit points with their own strategy and use capital management as a fixed weight in all their transactions.

IOTAUSDT - Head and Shoulders LongHi. On IOTAUSDT we see the well-known "head and shoulders" formation. The situation is standard: for quite a long time (1.5 months) we are pushing the level. And now, we have a good chance to break it. The most important thing is not to make a false breakthrough and to fix position above 0.2521. We will put a stop at the previous low at 1h timeframe - 0.2466. Target at the next expected resistance level of 0.2728.

IOTA : Wyckoff trending idea looks promisingIOTA like many other tokens looks like playing the "Wyckoff accumulation Textbook".
Let's see if this plays out.
Note that marks signed on the chart are irrelevant with time and price. They were drawn randomly and not after checking the correct period time intervals and price changes.
Not financial advice!
This post is just an idea! Do you agree? What's your opinion?

IOTAUSDT is between two Daily structures!IOTAUSDT had a breakout from the descending dynamic daily resistance, which is a technical analysis term that refers to a trend line drawn along a series of recent highs that act as a resistance level for the price.
After the breakout, the market is now ranging between the daily structures, which are significant levels of support and resistance on the daily chart. These levels are important because they represent areas where there is a significant amount of demand (support) or supply (resistance), meaning that buyers or sellers are likely to enter the market and push the price in a certain direction.
Currently, the price of IOTAUSDT is inside the descending channel on the 4-hour timeframe, which is a chart pattern that is characterized by a series of lower highs and lower lows. The market is waiting for the breakout and retest of the daily resistance as new support.
The support level is a price point where there is a significant amount of demand, meaning that buyers are likely to enter the market and push the price up. In this case, the daily resistance level is expected to act as a new support level if the price breaks out above it and retests it successfully.
If the price of IOTAUSDT satisfies Plancton's Rules, which are a set of trading rules based on price action and market psychology, it could signal a good opportunity to open a new long position, which is a bet that the price will continue to rise.
–––––
Follow the Shrimp 🦐
Keep in mind.
🟣 Purple structure -> Monthly structure.
🔴 Red structure -> Weekly structure.
🔵 Blue structure -> Daily structure.
🟡 Yellow structure -> 4h structure.
⚫️ Black structure -> <= 1h structure.
Follow the Shrimp 🦐

Iota is about to take offIota is high and horizontal but not down
It shows that there is a main support plate
It is recommended to buy in batches
pay attention to me and take you to realize wealth freedom

IOTA/USDT - take out the low and goThis an example where we form the fib compression pattern and then we take out the low to grab the liquidity and continue the trend.
We clearly bounced after taking out the low, so we're good to enter now to aim for TP1 at a risk to reward of more than 3.


IOTAUSDT future for 5%/50% Absolute X3My recommended trades are based only on the uptrend of the market. It will be opened in the time frame of 1 hour and at the end of the day, profit trading will be closed with any amount of profit. And only losing trades will remain open until they are liquidated. This trading strategy is backtested and works only in an uptrend.

IOTAGood breakout and retest.. targets on green. Last target is hard resistance if we pass it we might fly again..
Midterm trade.

MIOTA longMIOTA broke trough the resistance area. Asset broke trough the descending trendline. Bullish movement to resistance level at 0.25 is possible.

IotaUsdt laging but can explodeiota chart rdy for explode and big pump
now touch resistance trend line but iota can break middle channel adn save that position. iota can pump to top of channel
iota after touch MA200 Daily back bottom but after break ma200 daily can pump. now battle with resistance after that ma200 and trend line after that iot free. so you know 3 reisstance in way.
you can see MA200.
GL
EntryPoint:
0.2197
0.2112
Supports:
0.2029
0.1917
0.1784
0.1627
Resistance:
0.2309
0.2551
Targets:
0.2967
0.3457
0.4290
0.5652
Midtime:
0.8021
0.9633
1.2512
HODL:
2.0487
2.9097
GOAL is 4.5337 but this so hard way
GL
IOTA USDT TODAYApply your own risk management.
hunt the profits at any level you see convenient for you.
Green Zone for entry,
Red Level Exit,
Yellow levels are targets.
have a good day guys.

IOTAUSDT | BEARISH CHANNEL BROKEN
IOTA has been trading in bearish parallel channel .
The price is printing lower lows and lower highs
The price is currently broken above the upper boundary of channel.
There is a confluence point having rising support too.
It is trading at an important zone.
The bears will get control on support zone.
Manage your levels accordingly.

iotaIota techncial analysis basically on elliott waves Principles and Priceaction Strategy
iota can be grow to 0.70$
wait and watch.

IOTAUSDTRisk warning, disclaimer: the above is a personal market judgment based on published information and historical chart data on Tradingview, all analysis is only subjective. Hope investors consider, that I am not responsible for your investment decision.
Thank you.
Good luck

Iota UsdtWell as we all know, everything follow the BTC, but it's some levels of IOTA
Just to keep an eye on it
NFA
