IOTAUSDT trade ideas

Strong Breakout, now Pullback | Long BiasWeek Chart
IOTA has soared to $0.37 and now it's pulling back to #FairValueGap around $0.225 this level is good for Long Position
Wait for declined this support to confirm Breakout & Retest

Iotausdt trading opportunityIotausdt has experienced a significant breakout from a bearish pattern known as the falling wedge , and it has even surpassed the crucial bearish trendline originating from the recent all-time high. After a pullback to the trendline, the price appears to be undergoing potential accumulation, indicating a potential continuation of the bullish trend.
The immediate buy zone presents a favorable opportunity to make purchases and target the specified levels on the chart.
Additionally, if the price fails to hold in the immediate buy zone, the important buy back zone is expected to serve as a strong demand area for the price.
Your input on this post would be greatly appreciated.
Thank you.

Iota is breaking out!!!!Hey guys in opinion IOTA is breaking out and its starting wave 5 and after that we are expecting correction.not financial advice! Hope you support!

IOTA Possible Long Scenario IOTAusdt here looks interesting i think it can push higher from here.
Longing here 2800-2850
Stoploss very tight at 2750
High risk but if RR is very solid from here if it holds here.
Can be switched to swing long too later.
Initial target marked 0.3700
DYOR
Note: Not a Financial Advice.

IOTA(IOTAUSDT): Bullish Outlook Explained!IOTA has recently surpassed and successfully crossed over a significant downward trend line. We can already observe its retesting on the 4-hour time frame, where a descending triangle pattern has formed.
The resistance line within this pattern has been broken, which is a significant sign of the buyers' strength. As a result, I anticipate a bullish trend to continue towards the next resistance level...Trade safely 👍✅️

IOTAUSDReview
I suggest looking at this coin from a long-term perspective, because this is one of those assets that you can take into your portfolio.
Throughout the bear market, buyers were able to hold onto 2 year support. Since June 2023, the price has increased by 175%, which gives us excellent prospects for big growth during the altseason.
It’s not worth buying a coin right now, because it’s very likely that we can see another good drop in alts. In the near future, we also expect that the coin will move in the channel, which began to form back in 2018.
Why is it worth taking a closer look at this particular coin?
IOTA became the first registered distributed ledger technology (DLT) fund under the auspices of the Abu Dhabi Global Market (ADGM) in the UAE. The move highlighted IOTA as a leader in digital finance in the Middle East and North Africa (MENA) region.
Also you can ask for only 1 altcoins analysis and i will try to do my best to cover as much as i can✍️

Iota longOn the weekend I was checking old coins, as it is clear that sooner or later it will be their turn.
Here separately I would like to talk about Iota , which is one of the first big one which started its run early 2021.
We see a good volume spike on the coin to USDT pair, I think that we should see a run after 100+ weeks of reaccumulation?
In 2024 they plan to make their blockchain EVM-compatible, lock coins in staking and pull liquidity from ETH and L2. The chart supports such plans😏
I plan to buy it at $0.19-0.23 with targets of $0.9-1.4. I will give an update as we move.
By the way, the project with German roots, sitting in Berlin, das ist fantastisch.

IOTA - 4H#IOTA has wrapped up its pullback and correction phase, primed to kick off the next bullish leg.
The two powerful bullish runs signal strong buyer momentum – the uptrend looks set to roll on! 🚀


#IOTA/USDT#IOTA
The price has been moving in a bear flag since July 2023
The downtrend has been broken
The moving average100 was also broken above
We also have oversold conditions on the MACD
Current price 0.2850
A rebound to 0.2270 is expected
Target 0.3640
Which represents 150% of the current price
You should pay attention to the retracement areas as shown on the analysis

IOTAUSD Chart show's the possibitliy of the cup and handle pattern.
Possibility that the price will continiue rising to the minimum of 0.6$.

IOTA (Crypto MIOTA ) Sell TF H4 TP = 0.2347On the H4 chart the trend started on Dec. 4 (linear regression channel).
There is a high probability of profit taking. Possible take profit level is 0.2347
But we should not forget about SL = 0.3696
Using a trailing stop is also a good idea!
Please leave your feedback, your opinion. I am very interested in it. Thank you!
Good luck!
Regards, WeBelieveInTrading

iota can push again for 0,37 ? IOTA buyers are trying to get a momentum after huge movement and sell of profits on 0,37 weekly resist level.On the 4 hour chart downtrend line was broken to upside and retested.
Above the 20 Ema line and 0,3010 resist level i think bullish direct could get confirmation.Possible target will be 0,37 resist level again.

IOTA GET LOWER THEN?!Hello Traders and everyone, I am Hadi Karaali, Known as SNIPERS_FX
If you like the idea, do not forget to support with a like and follow.
IOTA WHAT'S NEXT!
As we can see price broke above our channel and above our major swing high. which results by a clean shift in momentum from bearish to bullish.
Meanwhile, and for now, as the price will be approaching our lower demand zone, we will start looking for new longs on lower time frame,
Unless price managed to break below, then another massive rejected zone will be faced, where we will be also looking for new longs as well.
Until that happens, price can still trade higher and higher.
If you like this kind of analysis don't forget to like and follow
and as usual follow your trading plan and manage your risk.
Be patient and good luck!

"Analyzing Bearish Trends: $IOTA SHORT " Analyzing Bearish Trends: A Technical Examination of IOTA's Decline in Value" BINANCE:IOTAUSDT
DOUBLE TOP ON #IOTA / USDT
AND STILL ON NECKLINE ! FOR BREAKING ! SO WE HAVE TO OPEN SOME SHORT POSITIONS ON IT !
🔶️COIN NAME : #IOTA / USDT
BINANCE:IOTAUSDT
🔶️Direction :🔴Short🔴
🔶️Levrage : 10x - 20x
🔶️ Entry : 0.3255 - 0.3335
🔶️ Stop Loss : ⚠️0.3415⚠️
🔶️ Targets : 0.3215 - 0.3175 - 0.3125 - 0.3055 - 0.2975 - 0.2795

IOTAUSDT (4H) - Bearish reversalHi Traders
IOTAUSDT (4H Timeframe)
Waiting for the downward break of 0.3134 support level which will complete a bearish trend reversal pattern to go SHORT. Only the upward break of 0.3698 would cancel the bearish scenario.
Trade details
Entry: 0.3134
Stop loss: 0.3698
Take profit 1: 0.2785
Take profit 2: 0.2221
Score: 4
Strategy: Bearish reversal

iotaiota technical analysis basically on elliott waves principles and priceaction strategy
iota can be grow fast
wait and watch


IOTAUSD - 100% increase in price next weekChart show's the possibilty of the parabolic pattern and the targets.

IOTAUSDT Elliott Waves AnalysisHello friends.
Please support my work by clicking the LIKE button👍(If you liked). Also i will appreciate for ur activity. Thank you!
Everything on the chart.
Targets: 0.23 - 0.27 - 0.36
after first target reached move ur stop to breakeven
Stop: ~0.14 (depending of ur risk). ALWAYS follow ur RM .
RR: 1 to 5
risk is justified
Good luck everyone!
Follow me on TRADINGView, if you don't want to miss my next analysis or signals.
It's not financial advice.
Dont Forget, always make your own research before to trade my ideas!
Open to any questions and suggestions

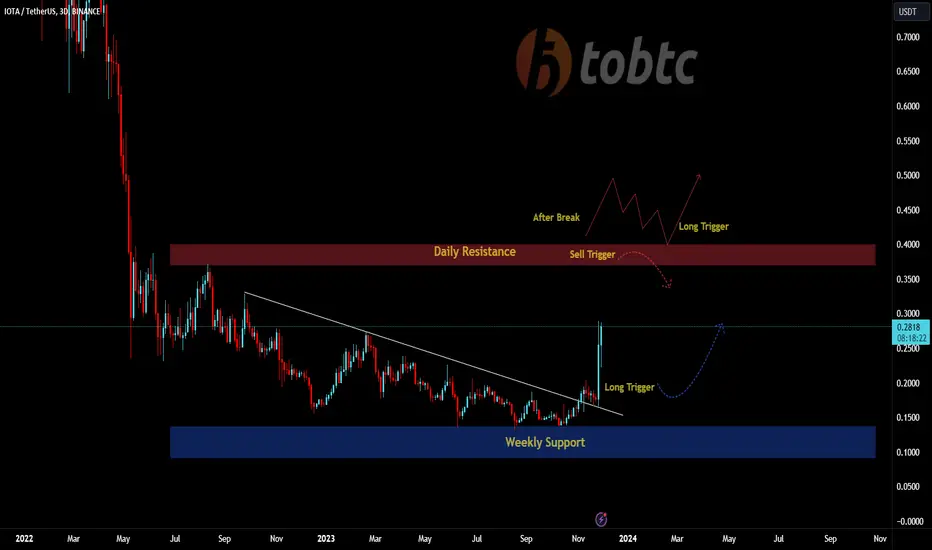
#IOTAUSDT #LQR #TOBTC #LaqiraProtocolThe price is moving from the weekly support zone with a strong bullish candle to the forward resistance. In the lower time.you can adjust to the Bitcoin levels and confirm according to your strategy to look for reasons to enter the ceiling area. This analysis is a personal view and the offer is not to buy or sell.