IOTABTC 1D bull flag long setupTA explained
IOTABTC seems to be finalizing a bull flag after breaking out of a falling wedge on the daily timeframe. Bull flag is considered a continuation pattern, so if it does breakout another leg up to the extended -0.272 fib level can be expected. First target is just below this fib level and aligns just below resistance zones in the past. Higher targets are based on previous resistance zones as well. Stop loss is below the 0.718 fib level drawn on the daily timeframe of the last impulse and below the 20EMA, 50MA, 100EMA and 200MA on the daily TF.
This setup can be traded with leverage in margin. Maximum of 3x is advised for this setup.
Trade setup
Best entries: 0.00002450 - 0.00002520
TP1: 0.00002800
TP2: 0.00003363
TP3: 0.00003949
SL: 0.00002220
RR: 5
Max leverage: 3x
—————
Do Your Own Research (of course)
Trade at own risk (of course)
Only trade what you can afford to lose (of course)
IOTBTC trade ideas

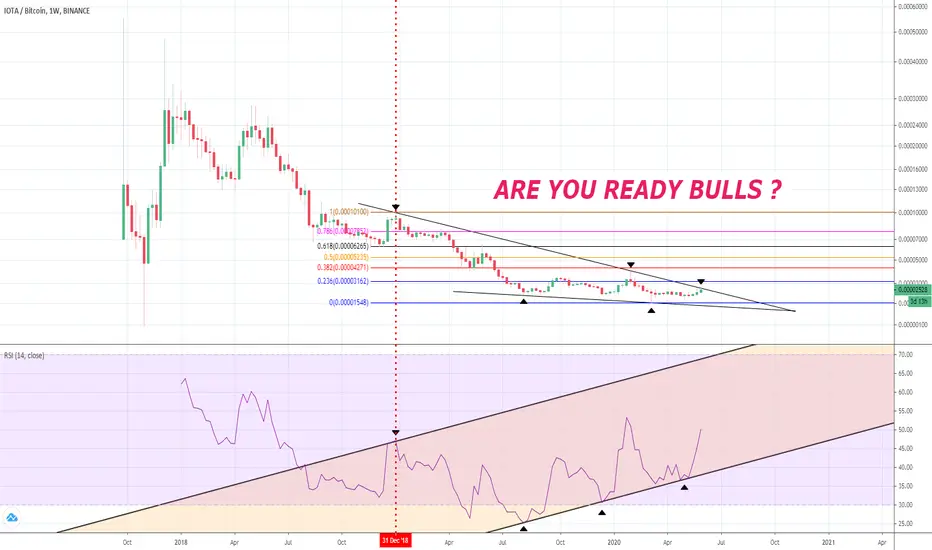
IOTA/BTCDon't expect for an altseason to return like 2017.
But still you can capitalize massive gains on these shitcoins.
Looking to trade for a 50% profit here.
We passed the point of control on the volume by price. so that is indicating that a battle has been won by the bulls on the resistance of 2400 sats
Also the IOTA trinity wallet came out. not very relevant on price but anyway... its looking pretty good.


There is a trading opportunity to buy in IOTABTCMidterm forecast:
While the price is above the support 18.20995, beginning of uptrend is expected.
We make sure when the resistance at 26.50000 breaks.
If the support at 18.20995 is broken, the short-term forecast -beginning of uptrend- will be invalid.
Technical analysis:
A trough is formed in daily chart at 18.29715 on 05/07/2020, so more gains maximum to Major Resistance (26.50000) is expected.
Price is above WEMA21, if price drops more, this line can act as dynamic support against more losses.
Relative strength index (RSI) is 71.
Trading suggestion:
. There is a possibility of temporary retracement to suggested support zone (0.00002171 to 0.00002090). if so, traders can set orders based on Price Action and expect to reach short-term targets.
Beginning of entry zone (0.00002171)
Ending of entry zone (0.00002090)
Take Profits:
TP1= 0.00002650
TP2= 0.00003084
TP3= 0.00003450
TP4= 0.00003911
TP5= 0.00005960
TP6= 0.00008280
TP7= 0.00011400
TP8= 0.00018494
TP9= 0.00023550
TP10= 0.00028590
TP11= 0.00045020
TP12= Free
Trade Setup:
We opened 12 BUY trade(s) @ 0.00002182 based on 'Valley' entry method at 2020.03.27.
Total Profit: 4824 pip
Closed trade(s): 468 pip Profit
Open trade(s): 4356 pip Profit
Closed Profit:
TP1 @ 0.00002650 touched at 06.04.2020 with 468 pip Profit.
Open Profit:
Profit for one trade is 0.00002578(current price) - 0.00002182(open price) = 396 pip
12 trade(s) still open, therefore total profit for open trade(s) is 396 x 11 = 4356 pip
❤️ If you find this helpful and want more FREE forecasts in TradingView
. . . . . Please show your support back,
. . . . . . . . Hit the 👍 LIKE button,
. . . . . . . . . . . Drop some feedback below in the comment!
❤️ Your Support is very much 🙏 appreciated! ❤️
💎 Want us to help you become a better Forex trader ?
Now, It's your turn !
Be sure to leave a comment let us know how do you see this opportunity and forecast.
Trade well, ❤️
ForecastCity English Support Team ❤️

IOTA Silently Breaks MA200, 81% MappedIOTABTC wasn't on my radar, but here we can see it moving since early May.
Prices broke the down trendline and also closed above MA200 (sitting now at 0.00002488), this is where the circle is on the chart.
Note: If prices drop below the support (orange box), this bullish potential is lost and a new analysis is needed.
Thanks a lot for reading.
Namaste.


IOTA on the way to increase for 100% IOTA might perform very strong in upcoming days, weeks... but as you can see we explained you short term analysis for this smart cryptocurrency. So on, Iota have already gave us signs to entering position in buy. Previous week volume and broken resistance tell us bullish performance and sellers failure.
Because we didn't broke last supply, we still have to, even if we've already entered buy move. After breaking through supply spot, we can expect next target;
T1 is at 32 cents
T2 is at 40 cents
T3 is at 44 - 47 cents (100% and more)
We are looking very closely for this 100% move, but do not forget about ''supply spot'', Target 1 and Target 2 .
Hope you followed also NEO analysis from previous week. Price broke thorugh our First target very strong and is headed to higher targets
Video explained by Martin Mohar,
Presented by Elitefxacademy

ALTUSDI've just checked some charts. Most altUSD pairs seem to be at resistance here on weekly, so it's not a bad place to book some profits. But on BTC's next leg down (the one to 7.7k maybe?), alts could be worth investing in (mid term), at the expense of BTC. including IOTA and QTUM, have good mid term potential it they don't break support on BTC's drop.
But considering how slow BTC is these days and how dominance is correcting, alts shouldn't be hit as much as in March on the leg down. Still, it's not an area to buy but to book profits now. Unless there's a convincing breakout...


IOTA swing potentialInfo on the chart
For information on BTC volatility follow our BTC ROADMAP chart.


Afunilamento iota pre AltsseasonDepois de muito tempo criando pequenas ondas descendentes o ativo começou a afunilar e lateralizou, isso aconteceu com a maioria das altcoins antes dos pullbacks de 2017, melhor hora para holdar o ativo , a relação de tempo necessária pode variar dependendo de quanto tempo leve a acumulação.( apesar do alto risco então tenha noção )
Entradas: ( de preferencia fracionadas )
2000
1850
1600
Alvos formação de elliot:
8.400
17.000
22.500

IOTABTC Ascending Triangle Breakout Soon! Up To High?!IOTABTC Ascending Triangle Breakout Soon! Up To High?!
IOT/BTCWelcome to the crypto bubble.
Nobody left trading alts vs BTC . Nobody left yelling "alt season".
All important traders are dead.
(No, not you with your 0.1BTC or 1BTC - whatever is left in your stack from this 28 month alt bear market. Take no offense, 99.9999% of traders got rekt from these pump and dumps.)
Alt markets are out of sellers and the algorithms have found that threshold, where there's more buyers than sellers.
Bottom is in, where alts vs BTC is concerned.
I'll cover 10ish major cryptos that are worth trading, then I'll leave you guys alone for a while.
They are worth trading for the following reasons:
Fundamentals - Niche/target market, competitor comparison, development, necessity, use-case/potential demand, age, etc
Longevity - they've survived attacks on the technical and financial fronts (pump and dumps) - the longer an asset or species or coin is able to remain dominant, the more likely it is to remain dominant
(obviously, there's diminishing returns to that theory, post-adoption curve)
Liquidity - trading on margin invites additional market makers for both support and resistance - falling knives stop when big buyers have orders up, ready to buy cheaper
List of pairs I will be trading:
XRP/BTC - Real Time Gross Settlement - Proof of Correctness
XLM/BTC - Real Time Gross Settlement - Stellar Consensus Protocol - Jeb has always been about the people, which is why he left Ripple. More likely to gain traction, if run correctly.
ETC/BTC - Smart Contracts - Potential testnet for Ethereum/replacement, should FUD arrive again. Never forget, Ethereum lost the right to claim immutability. Good hedge to Ethereum bet.
IOTA/BTC - "Tangle is better than blockchain" - People love to FOMO this shitcoin. The fact is that Tangle will theoretically be better than blockchain, but that's probably way down the road, after IOTA dies. It'll pump HARD though.
ETH/BTC - Smart Contracts (Demand should grow globally)
LTC/BTC - Silver to Bitcoin and trustworthy testnet that can deploy innovation, without as rigid scrutiny s as BTC .
XMR/BTC - Anonymous (Ring CT )
BCH/BTC - Only potential Bitcoin competitor. Roger Ver is doing a fantastic job with this, by the way. I know, he gets emotional, but he's light-years ahead of 99% of people in this space.
EOS/BTC - Ethereum on Steroids. Expected to fail, as Ethereum will be the hardest thing in crypto to dethrone. It pumps like nuts when there's FOMO though.
NEO/BTC - Smart Contracts (Demand should grow from China)
ZEC/BTC - Anonymous (Zero Knowledge Proofs)
Based on Poloniex's moves with TRX in recent past, and the belief that the market alpha owns Polo, with that "Circle acquires Poloniex" news from forever ago (which we can get into another time), it appears to me than there are a lot of plans for Tron.
Although Justin Sun struck me as malleable, under-experienced and deceptive, this project has everything it could need, to go global. As a commodity/investment, or, as a patsy...
The TRX/BTC pair may be added to my list, if it meets my criteria in the coming months.
Regards

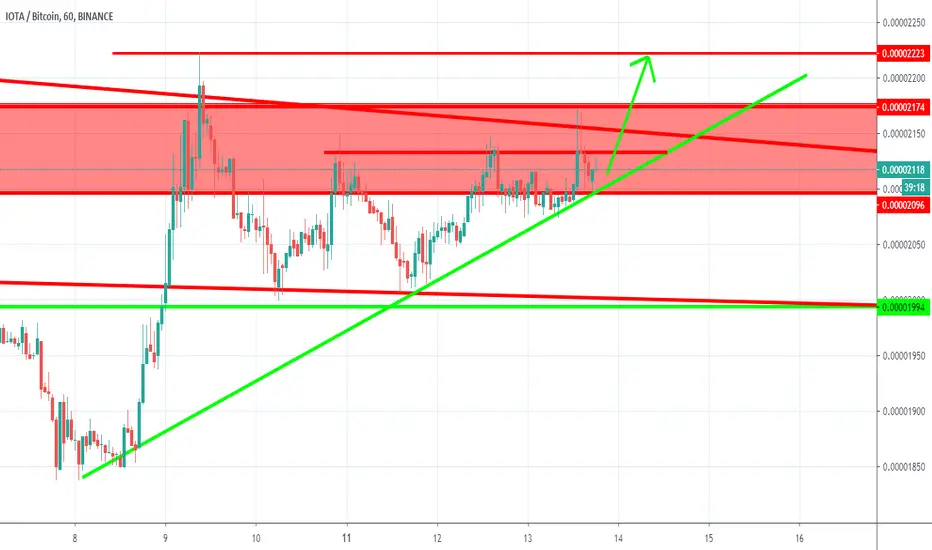
IOTABTC broke triangle 🦐IOTABTC broke triangle and retested it.
The price creates another little triangle below the main structure, if the price will do downside ''breakout'' could be create another great impulse

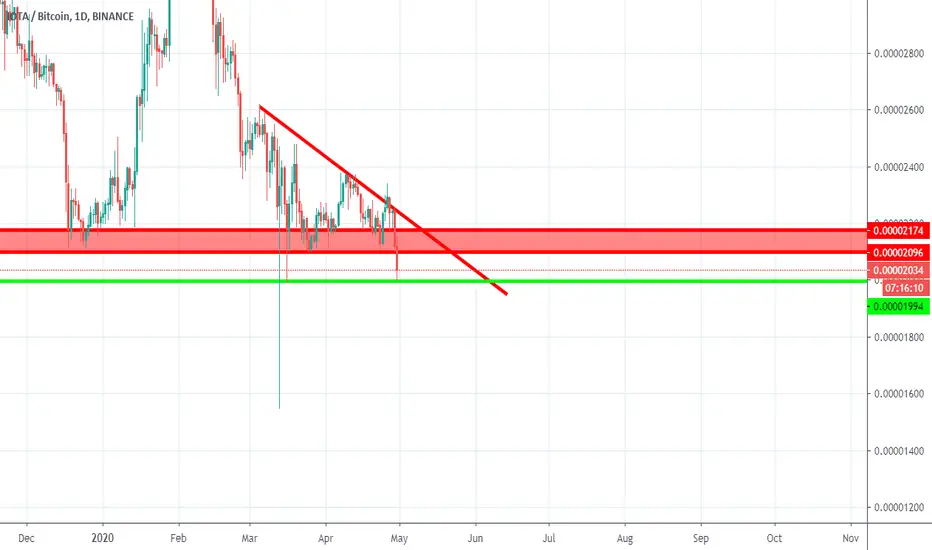
IOTABTC Support Became Resistance...IOTABTC Support Became Resistance... and it's a strong one I guess haha


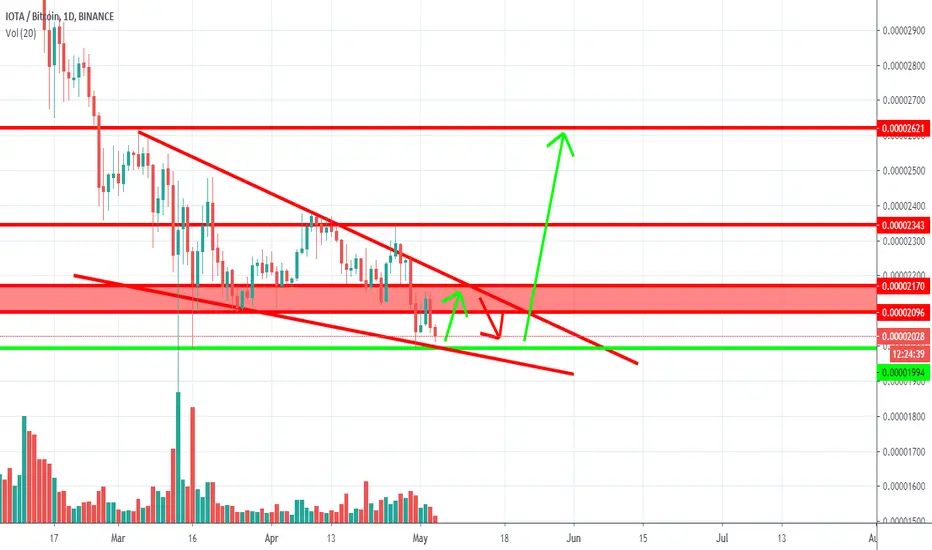
#IOTA - Damn, Just TOO BullishSo, there is a clear horizontal support at 2100 sats. Moreover, there is a double bottom (1st touch at the 20th December 2019 and 2nd touch now at March-April 2020). But that's not all. There is also a "W" pattern which was drawn on the chart.
Thanks to a number of these bullish factors, the price just broke one of the strongest descending resistances, good entry point is now. Stop Loss should be placed below the support mentioned in the beginning of this idea.

IOTA / BITCOIN (IOTABTC) DailyDates in the future with the greatest probability for a price high or price low.
The Djinn Predictive Indicators are simple mathematical equations. Once an equation is given to Siri the algorithm provides the future price swing date. Djinn Indicators work on all charts, for any asset category and in all time frames. Occasionally a Djinn Predictive Indicator will miss its prediction date by one candlestick. If multiple Djinn prediction dates are missed and are plowed through by same color Henikin Ashi candles the asset is being "reset". The "reset" is complete when Henikin Ashi candles are back in sync with Djinn price high or low prediction dates.
One way the Djinn Indicator is used to enter and exit trades:
For best results trade in the direction of the trend.
The Linear Regression channel is used to determine trend direction. The Linear Regression is set at 2 -2 30.
When a green Henikin Ashi candle intersects with the linear regression upper deviation line (green line) and both indicators intersect with a Djinn prediction date a sell is triggered.
When a red Henikin Ashi candle intersects with the linear regression lower deviation line (red line) and both indicators intersect with a Djinn prediction date a buy is triggered.
This trading strategy works on daily, weekly and Monthly Djinn Predictive charts.
This is not trading advice. Trade at your own risk.
