IOTA / BTC OK guys, IOTA will be available to 50x on Binance Futures tomorrow. I have already taken my position on the orange highlighted area. Two weekly closes above it + this time all alts are looking bullish so why not take advantage of the unpumped ones.
As long as the orange area holds , IOTA is heading to the following targets :
TP 1 : 4546 ( where I'll be closing most of my position because I'm not a long term holder)
TP 2 : 6600
TP 3 : 9500
SL : Will cut it manually if I see a daily close under 2800.
IOTBTC trade ideas

IOTA/BTC BULLISH!
IOTA touched our 0.5 Golden fib retracement at 3057sats then a bounce up needs to hold support trend-line to continue
the next pump for this coin target will be 3652-4196-4500sats.

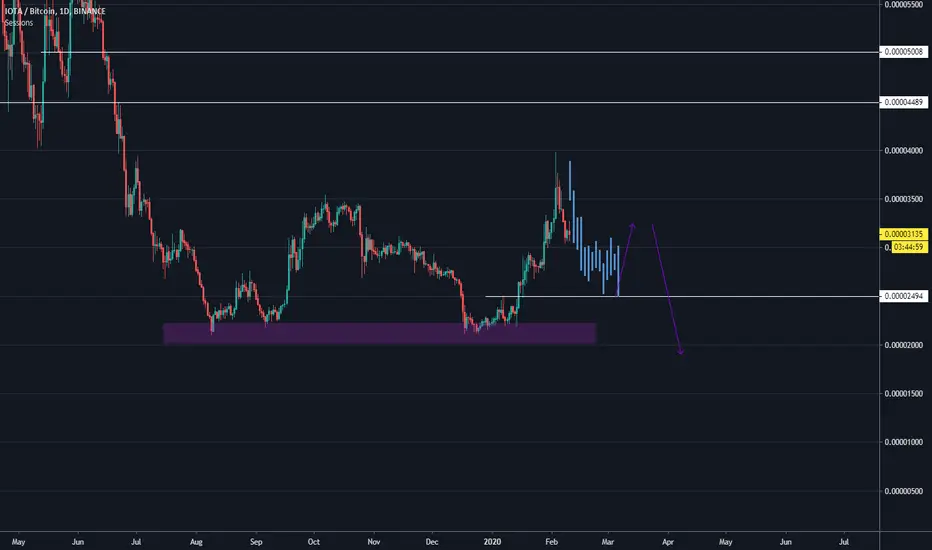
Don't get happy.This here is really what I see on this Coin... look for areas to sell into rather than buy
we will see over time
I work of ipa el eh and BC.
SNM.


IOTA/BTCWe have a crazy resistance in Fibonacci 0.246 need to break it out with a strong candle to see next levels :)

IOTABTC has Bullish and Bearish Wolfe Wave pattern IOTABTC has Bullish and Bearish Wolfe Wave patterns found by EBU Indicator.

IOTA/BTCI decided not to trade shitcoins this time around, but there's simply too high of a level of certainty to NOT trade it.
Accepting the rally, bailing when FOMO hits.
Compare to the coins that have popped - ETC, DASH, ZEC, BCH. Even BSV.
Trading algorithms go into buying frenzy when a higher high is made.
Alt season is here.
It's about to rain gold on your heads. Put out a bucket and don't take profit early, then try to short when it's "overpriced".
Buy dips when overall trend is up.
Sell rallies when overall trend is down.


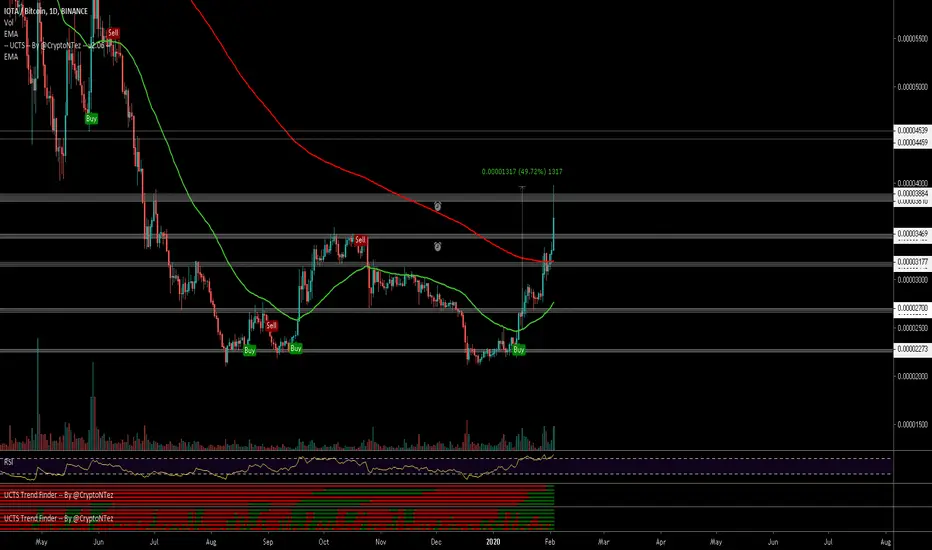
$IOTA, Starting the week w/ big flow of volume..$IOTA
Starting the week w/ big flow of volume that pushed price towards ~3800 sats resistance...
Over 50% up since UCTS Buy signal on the 1D (Buy signals across every HTF)
RSI overbought levels
On my eyes, buying here seems risky..
Wait for retests/flips of prior levels
#IOTA
iotaiota break very big resistance at main chart . if iota cab hold 0.00003756 then 100% toch 0.00006153 but if iota cant hold 0.0003756 then according to red arrow will go to 0.00000618

IOTA Builds Momentum, Additional 44.44%+ PossibleIf IOTABTC continues in the path it is going, we are likely to see prices hit 0.00005698 soon.
The green space on the chart represents our "Decision point", above this level prices for IOTABTC can easily continue higher, but if prices move below this line we can see a drop take place.
This chart is extremely bullish and we have all EMA10s converging and starting to curve up, IOTABTC is already trading above EMA200 challenging EMA300 in grey.
Trading volume is really good and the RSI is strong, we can expect more growth in the weeks to come.
Thanks for reading.
Namaste.

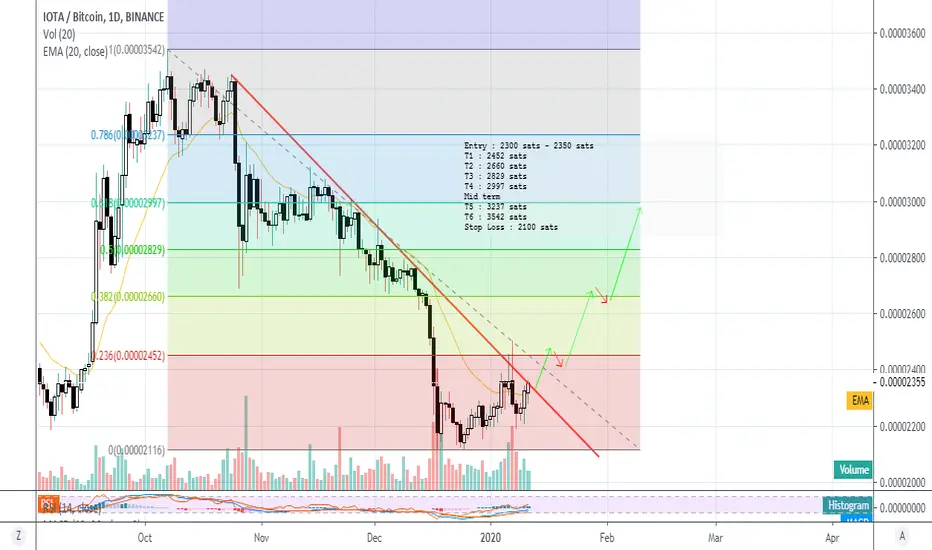
#IOTA : Short To Mid Term Profits OpportunityEntry : 2300 sats - 2350 sats
T1 : 2452 sats
T2 : 2660 sats
T3 : 2829 sats
T4 : 2997 sats
Mid term
T5 : 3237 sats
T6 : 3542 sats
Stop Loss : 2100 sats
IOTABTCExit the descending channel
Guys, if you like the idea please put like button, this will be the best thanks.
Thank you for your support, I appreciate it.

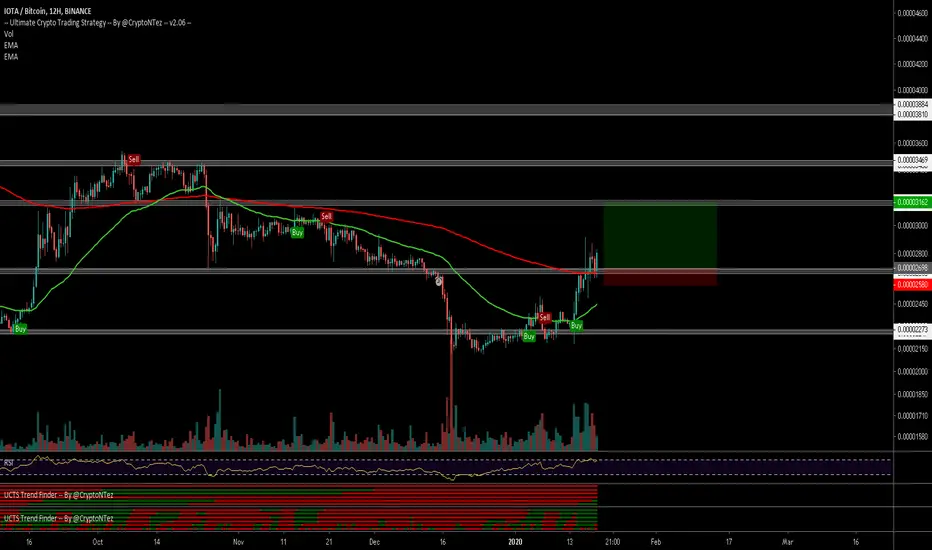
$IOTA, Flipping resistance into support at ~2700 sats level...$IOTA
Flipping resistance into support at ~2700 sats level...
UCTS Buy signal on the 1D/2D charts
RSI reaching overbought levels
Will like to see volume flowing in again (1D 📉)
If continuation happens (Tight SL due to BTC), then aiming for 3.1k sats 15%+
#IOTA
IOTA-BTC from 1/1/2020 to 1/28/2020 PROFIT round to 40.21% Moon!IOTA-BTC from 1/1/2020 to 1/28/2020 PROFIT round to 40.21% to the Moon!
IOTA is the most real and interesting future project for Germany and the World.

There is a trading opportunity to buy in IOTABTCTechnical analysis:
. Miota/Bitcoin is in a range bound and the beginning of uptrend is expected.
.The price is above the 21-Day WEMA which acts as a dynamic support.
. The RSI is at 63.
Trading suggestion:
. There is a possibility of temporary retracement to suggested support zone (0.0000267 to 0.0000213). if so, traders can set orders based on Price Action and expect to reach short-term targets.
Beginning of entry zone (0.0000267)
Ending of entry zone (0.0000213)
Entry signal:
Signal to enter the market occurs when the price comes to " Buy zone " then forms one of the reversal patterns, whether " Bullish Engulfing ", " Hammer " or " Valley " in other words, NO entry signal when the price comes to the zone BUT after any of reversal patterns is formed in the zone. To learn more about " Entry signal " and the special version of our " Price Action " strategy FOLLOW our lessons :
Take Profits:
TP1= @ 0.0000349
TP2= @ 0.0000455
TP3= @ 0.0000623
TP4= @ 0.0000810
TP5= @ 0.0001012
TP6= @ 0.0001507
TP7= @ 0.0001906
TP8= Free

BITCOIN IOTA D1We notice 2 candels on D1 time frame closed above the MA200.
As wee see those moves are accompanied by very nice volume.
The price is on the resistance for the moment but the break-out can open us the way to the higher moves.
We also pay attention to lower time frames.
On the H4 we can notice sth like an ascending triangle formation.
We have idicated the 'correction zone' taht can be a good entry (no obligation for that move ).

IOTABTC Making Bullish MovesIOTABTC which is up around 30% so far in January has broken above the 200 day moving average for the first time in 10 months.
The idea of Coordicide is starting to be positively received by the crypto community as more people are understanding the plan and implications.
Has the year of accumulation for Iota come to an end? Maybe..

IOTABTC 4HIOTA; made breakout and there is H&S- Bearish Cypher Pattern.. We are ready for a new wave, Break a leg!

$IOTA, Trying to flip ~2273 sats resistance level into support..$IOTA
Trying to flip ~2273 sats resistance level into support with slowly growing volume..
If happens, good room to grow with target at ~2700 sats (15%)
Tight SL under current level just in case...
#IOTA

IOTA gearing up, #ALTSEASONIOTA interest me for a few reasons
It made a 3 wave move down and in the final leg of the 3 we see a clean 5 wave structure
If this is correct IOTA can see significant gains in the coming months.
I still see downside in the med term but this should form a basing pattern soon to back this idea
TBC...
To keep up with the #crypto volatility give me a follow on twitter @satoshiiheavy
OR
for 24/7 365 coverage of #cryptocurrency & #forex join the #CCV Trading family in the link below :)
cheers!
www.cryptocurrentlyvip.com
