IOTA Links With Jaguar Reappearing - Pump?With the links of Jaguar Land Rover... Is it possible we could get a push due to the FA and the hype on this?
Totally possible but at the momentum market is flat so may not get as much excitement as previous announcements like this.
IOTBTC trade ideas


IOTA BTC BINANCE 1Dsuccessfully broke the another bearish channel and heading towards the resistance

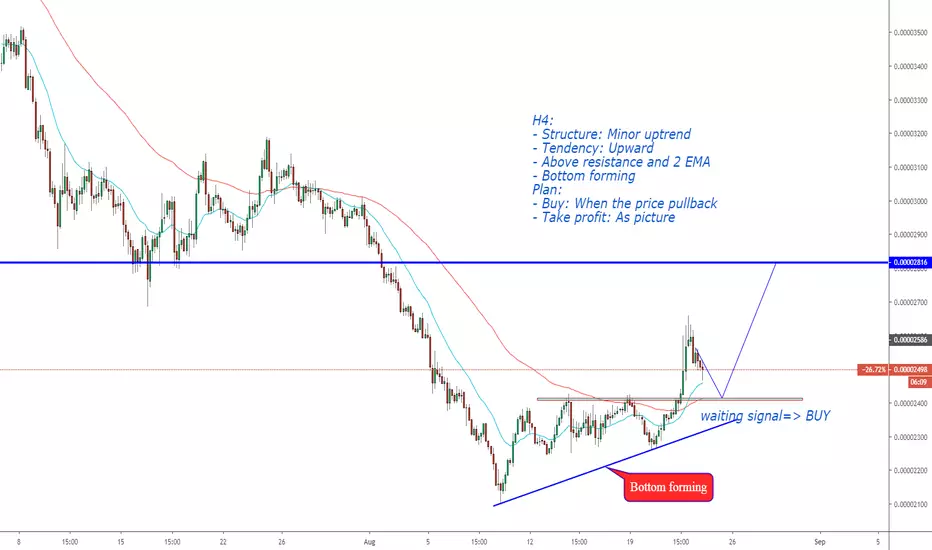
IOTABTC, Buy on h4.IOTABTC, Buy on h4.
H4:
- Structure: Minor uptrend
- Tendency: Upward
- Above resistance and 2 EMA
- Bottom forming
Plan:
- Buy: When the price pullback
- Take profit: As picture
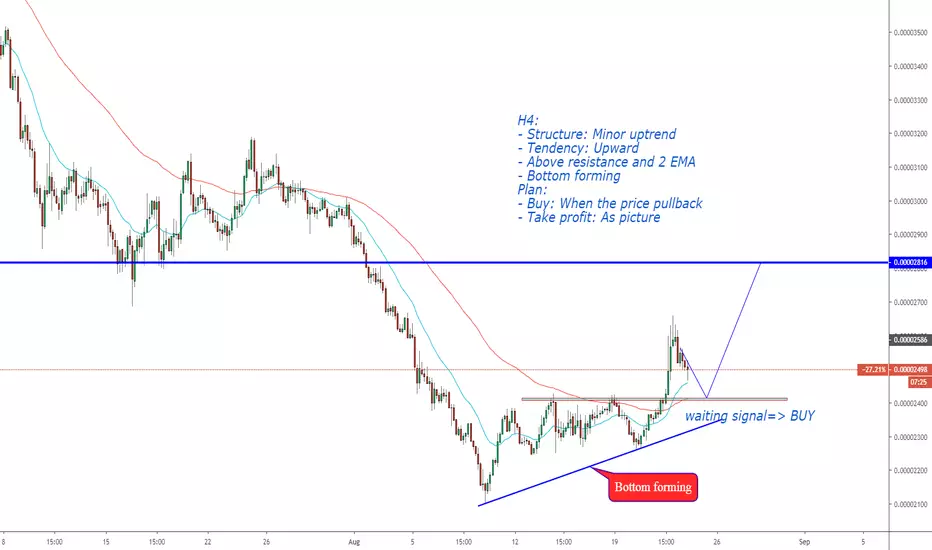
IOTABTC, Buy on h4.IOTABTC, Buy on h4.
H4:
- Structure: Minor uptrend
- Tendency: Upward
- Above resistance and 2 EMA
- Bottom forming
Plan:
- Buy: When the price pullback
- Take profit: As picture

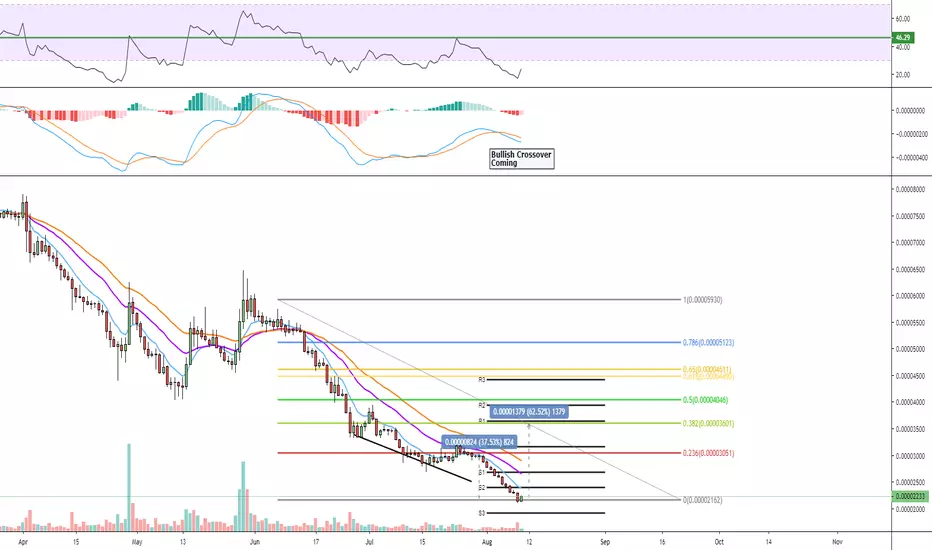
26% PROFIT AVAILABLETwo times rejection from ~2500 in btc value.
MIOTA is on his 3th try for breaking this resistance. (0.382 fibo)
if succeeds, so 26% percent profit is in your hands.
Don't forget to use stoploss!!!
@Bitcoin_altcoins_trade
Behzad

IOTA BTC BINANCE 1DBROKE THE DOWN-TREND FROM JUNE BUT WE CAN SEE ANOTHER CHANNEL AND RESISTANCE. LETS SEE

Momentum With Bulls For IOTA - IF BTC Plays BallBall is in BTC's hands. IOTA starting to show a small sign of a trend direction north. It does need BTC to play correctly and not blast out of this area.
IF BTC dominance does come down, coins like IOTA will get some love.

IOTA - LONG - BANDS MAKE HER DANCEBBands are tight on 4 hr, expecting a breakout up, anytime bands tighten, you should expect a huge divergence (either +/or -).


$IOTA - Time to accumulate.We're either on the brink of an Alt Season with BTC.D capping out at the 200MA weekly, or we're about to start creating a trading range. (or just another bearish retest before dropping lower - trade what is, not what you want it to be.)
Trading Range Entries/Exits:
Lowest Red Range = TP1
Highest Red Range = TP2
Lowest Green Range = Accumulate in/above.
Stop loss below current lowest low by 3%.
Trade current trend:
Acquire: 2280 - 2300
Targets:
2350 > 2388 > 2470 > 2510 > 2572
Stop loss: 2235


IOTA: Relief Rally against BTC. What are the next resistances?As Bitcoin got another punch yesterday, Alts started to rally against Bitcoin.
In detail this is what I see on 4H:
- The market got caught in a descending triangle in July which eventually led the price to follow a descending channel.
- At this time we also got a MA50/MA100 cross down shortly after. Notable is also that we got a MA50/MA100 and a MA100/MA200 cross down on the hourly chart while the price was in the triangle.
- RSI was overbought at the top of the triangle which supported the downward movement. Although following the downward channel, this led the daily RSI being oversold.
- MACD crossed down too when confirming the triangle with the down move.
The support on 2100 sats (or 0.25$) then stopped the downward movement (for now):
- The reversal got supported by a hammer candle stick, which is a bullish reversal candlestick pattern that mainly occurs at the bottom of downtrend.
- Price broke on the hourly chart trough the MA50 and MA100, now it is attacking the MA50 which is currently at 2100 sats.
- On daily, MACD may cropss soon up, and the RSI is abrely not considered oversold anymore.
- Price rallied about +12% since the bottom.
Now IOTABTC hast to face lot of further resistnaces to stop the bearish trend, amongst others this are:
- Resistance at 2800 sats.
- MA200 on the hourly chart
- MAs 50/100/200 on the 4 hour chart
- To stop the main bearish trend, a cross up of MAs on daily is needed.
This all can change vastly as BTC dominates this a lot.

IOTA - Support Found. Can it hold?With the majority of the alt-coins being smashed over the last few weeks. This gives a brief rest to those swimming in losses.
If BTC dominance does come down alts will turn back up again, how long for? Unsure but have a tight stop loss on this one. This could retest the EMA 34 on the daily and turn around again.
IOTA(MIOTA)IOTA WILL GO TO 0.00001919 BTC AND THEN HAVE 2 CASE:
1-IF IOTA HOLD 0.00001919 BTC THEN WILL GO TO 0.00004484 BTC
2-IF IOTA CANT HOLD AND BREAK 0.00001919 BTC THEN MAY GO TO 0.00000478 BTC .
PAY ATTENTION THAT IN PREVIOUS IOTA DUMP TO 0.00000017 BTC
GOOD LUCK


NOT LOOKING GOODAs almost 90% of alts, IOTA looks pretty weak at the moment, main range broken down (blue line), with 2 clear bearish channels. Main objetive based in fibonacci projection is at 1160 sats, not gonna touch it until we reach there or we see some bullish price action
Good luck.


Huge upside potential, 10% stop loss, margin on bitfinexWhat more do I need to say? Opportunity to have your BTC bag grow.
Gonna have to be careful holding this thru bitfinex's downtime, but IMO thats when the money is made. aug 1st 3pm or something.
