IOTA Yo peeps, pretty fresh to the trading scene. As we can see Cryptocurrency are going crazy right now.
Ive been looking at the technicals for it and seems like its lagging but has just looked to double bottom on the daily time frame.
This is what i am seeing on the shorter time frames which could be poised to take off.
What do you all think? Happy to take any pointers
IOTBTC trade ideas


$IOTA Bottoming out?IOTA Looks to have bottomed out
Currently price bottom of channel
Plus Stochastic RSI, RSI & MFI oversold
However thats on the daily, when you look at the weekly which is more powerful it looks possible for a 50% drop


Long setup iota btc on #binance
We are in a trading range characterized by strong buying and slow corrections, we are at the base, best RR ratio, some buying is showing with the rejection on the chart
Targets at supply areas


IOTA 3,13% GUARANTEE !IOTA/BTC
Don't forget the position sizing guys ;-)
Feel free to leave your comment if you want more cryptocurrencies analysis...
NB : I share informations in a neutral way, I don't offer any investment advice on specific currencies, or initial offers, and does not encourage anyone to enter what may appear to be investment advice, and then completely disclaims any liability for any investment decision made by the reader.

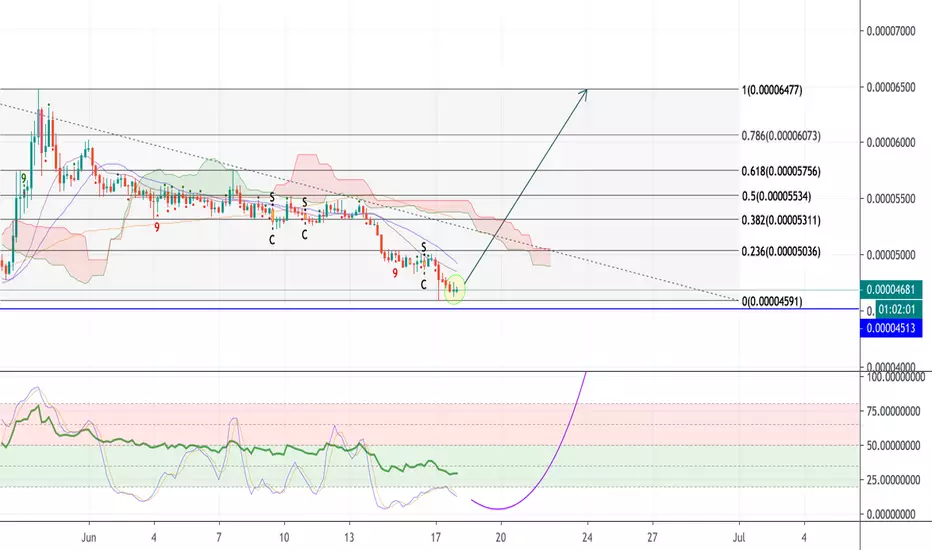
A trading opportunity to buy in IOTABTCTechnical analysis:
. Miota/Bitcoin is in a range bound and the beginning of uptrend is expected.
. The price is below the 21-Day WEMA which acts as a dynamic resistance.
. The RSI is at 36.
. While the RSI downtrend and the price downtrend in the daily chart are not broken, bearish wave in price would continue.
Trading suggestion:
. There is a possibility of temporary retracement to suggested support zone (0.00004600 to 0.00004025). if so, traders can set orders based on Price Action and expect to reach short-term targets.
Beginning of entry zone (0.00004600)
Ending of entry zone (0.00004025)
Entry signal:
Signal to enter the market occurs when the price comes to " Buy zone " then forms one of the reversal patterns, whether " Bullish Engulfing ", " Hammer " or " Valley " in other words,
NO entry signal when the price comes to the zone BUT after any of the reversal patterns is formed in the zone.
To learn more about " Entry signal " and the special version of our " Price Action " strategy FOLLOW our lessons:
Take Profits:
TP1= @ 0.00005410
TP2= @ 0.00006260
TP3= @ 0.00007060
TP4= @ 0.00008020
TP5= @ 0.00008540
TP6= @ 0.00009490
TP7= @ 0.00012870
TP8= @ 0.00018330
TP9= Free


IOTA is gonna to break and new tech is commingWe are at resistance but the team spoke about a new revolutionnary update on IOTA, if is true we will see a massive pump I think.
I buy the keynote and I will sell the update :D
I don't trade news normally, I don't risk more than 1% of my capital in this trade.
Not a financial advise (as always :D )

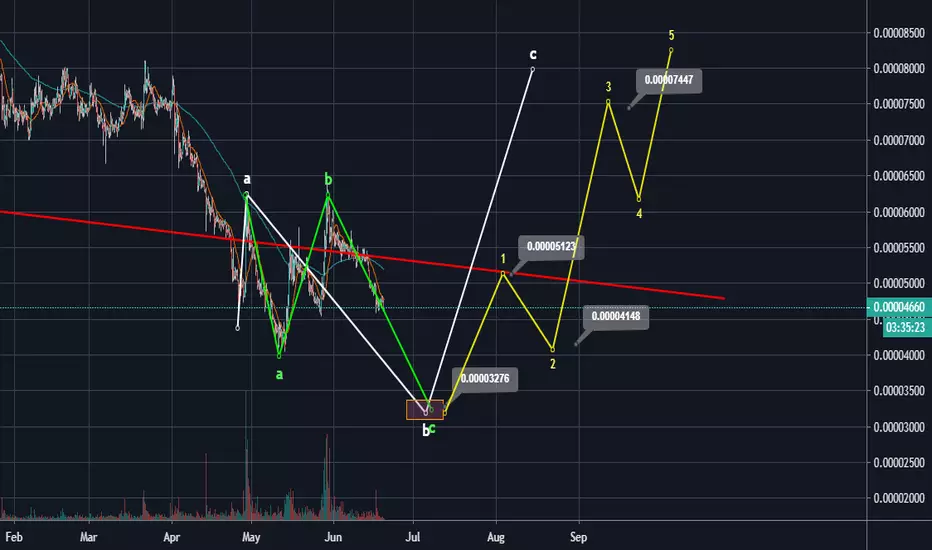
IOTA Waves Still learning wave theory, amongst many other tools, but wanted to share what I think may happen in coming months. From what I can see, it seems like this one is ready to go on a final small wave 5, slight correction, and bigger move in July-Sept. Having more Oscillators show an up trend is important, which is why I put a question mark by the Stochastics, paints a different picture compared to MFI and RSI.
**Not trading advice**

test strategy for IOTABTC on BinanceBINANCE:IOTABTC
correlation check
TP1 - 0.0000901 - 0.000104
TP2 - 0.0001751 - 0.0001848
TP3 - 0.0002347 - 0.0002536
#theminimalist

IOT BTC BUY (IOTA - BITCOIN)Hi there. Price is forming a continuation pattern to the upside. Watch strong price action at the current price for buy.

IOTA Potential Long tradeIOTA seems to be forming a pattern here
RSI seems to be bouncing off the trend line
Every time IOTA closes above the trend line(White) it pumps to +30%
SBS indicator yet to signal BUY
BUY - wait for the price to closes above Trend Line (White) and above EMA 21
Targets are on the chart
SL -5% of buy-in or below last support
This trade mite take time to develop

H&S IOTA 30% increaseJust wanted to share, Iota is making a great head and shoulder. Keep a eye on this one!!
This is for educational purposes, not financial advise.

IOTA/BTC patternAfter IOTA's announcement regarding the solution of the trilemma. Keeping an eye out for BTC/USD though.

IOTA to the MOON ! 27.04%Are you ready to make money ? :-D
I think there is a good support at this price level, so we will see after some hours/days how it will move...
What do you think about that?
Feel free to leave your comment to discuss and share information with crypto community ;-)
NB : I share informations in a neutral way, I don't offer any investment advice on specific currencies, or initial offers, and does not encourage anyone to enter what may appear to be investment advice, and then completely disclaims any liability for any investment decision made by the reader.


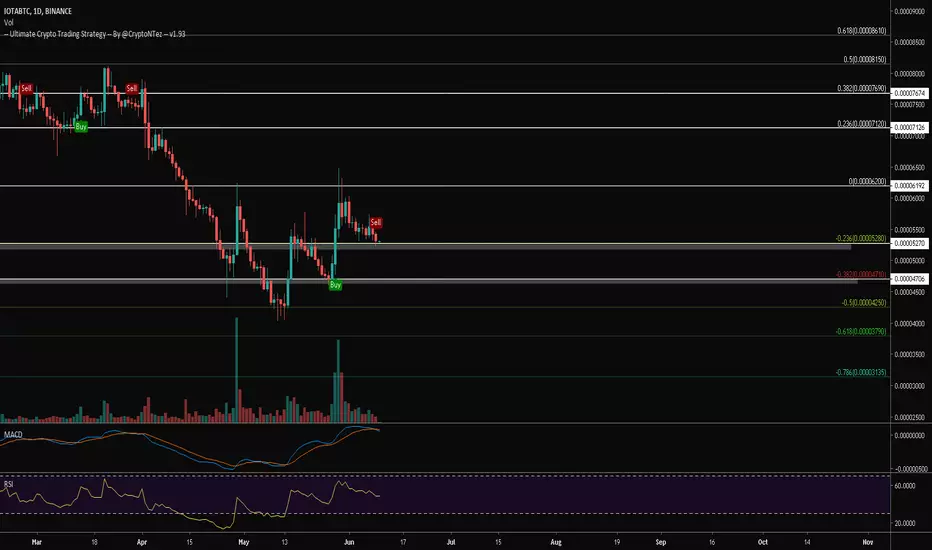
$IOTA Reached support at ~5270sats w/ decreasing volume...$IOTA Reached support at ~5270sats w/ decreasing volume...
Last iteration with this level went no good..
UCTS Flashing sell signal on the 1D
MACD just bearish cross
Not hodling this level would mean a new drop to 4700sats (10%)
Protecting your capital is your 1st priority
#IOTA
IOTABTC BINANCEIOTABTC formed inverted head and shoulder and reached the target of 43% over long period.
Currently, it is testing support at lower Fib level and soon it may break and reach multiple TP's as listed on chart.
Major resistance is 50% Fib level which would take another few weeks to reach over there, so holding coin is good for a couple of weeks.
