IOTABTC, SHS pattern on D1.D1:
- Pattern: SHS pattern
- Candle: Bullish outside bar
Indicator:
- RSI: up
IOTBTC trade ideas
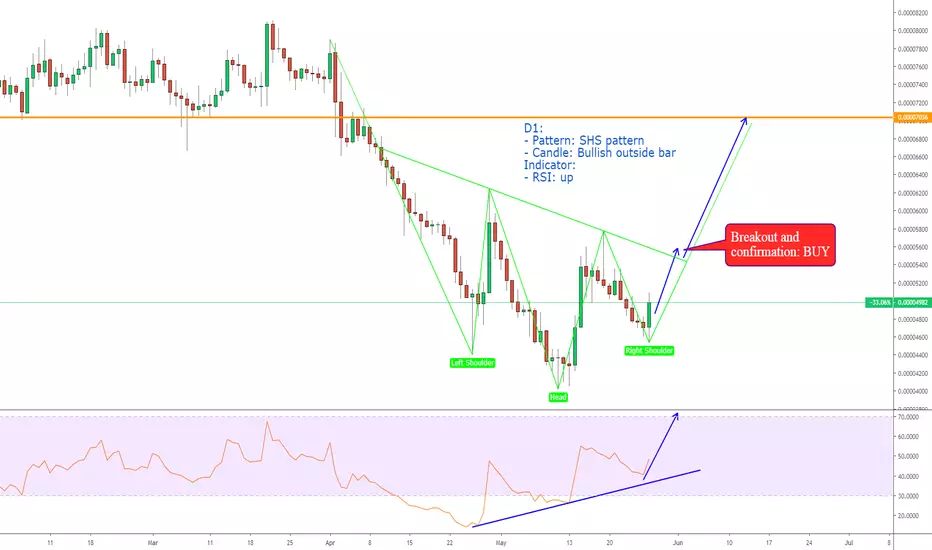
Expecting a trend-reversal on IOTA/BTC; Bullish!Inverted Head & Shoulders as a reversal pattern in a downtrend is forming. This can trigger a break-out from the falling wedge. Very bullish at the moment.


IOTABTC BINANCE IH&SIOTABTC is forming an inverted head and shoulder for long term holders. Please note that this may change based on mother BTC coin.
Best time to enter IOTA is near right shoulder and expect a breakout near the neckline with 35% profit reaching target 7400- 7600 sats


IOTA looking bullish!
4H Analysis | IOTA
Ichimoku cloud: IOTA's 4h chart shows crossing Tenkan/Kijun lines, where the Tenkan line moves above the Kijun line (= bullish Tenkan/Kijun cross). A bullish Tenkan/Kijun cross in the Kumo (cloud) implicates a bullish move. It would have been a stronger bullish signal if the cross occured above the kumo.
RSI: One of the reasons why I think this is a strong bullish scenario, is that the 4h RSI is sub 40, so there is al lot of room for buyers. Usually up to 70-ish RSI.
Bollinger Bands: A red candle has closed outside of the lower band. This indicates either a downward break or reversal. considering abovementioned analysis, I interpret this as an additional bullish signal.
1H Analysis | IOTA
The 1h chart confirms the 4h analysis in a sense. There is no bullish cross on the 1h, but it looks like IOTA/BTC is heading towards 5200 (about 6:00 PM GMT) Sub 40 RSI, the candles just bounced off the lower band and are moving upward, we maysee the candles testing the lower band again after bouncing off the middle (5050-ish).
This is my first idea published ever! Please let me know what you think!
Cheers!
- 1337crypt0trad3r

IOTA at most oversold since inception.Iota RSI is below 30 and also at the most oversold since inception (according to Binance).
If bitcoin plays along then we’re going to explode soon.

A trading opportunity to buy in IOTABTCTechnical analysis:
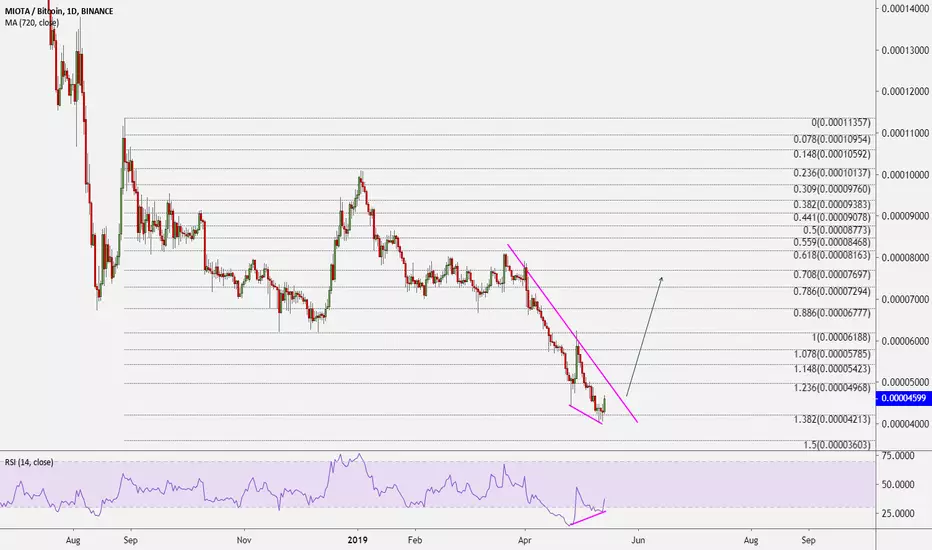
. MIOTA/BITCOIN is in a range bound and the beginning of uptrend is expected.
. The price is above the 21-Day WEMA which acts as a dynamic support.
. The RSI is at 53.
. While the RSI downtrend and the price downtrend in the daily chart are not broken, bearish wave in price would continue.
Trading suggestion:
. There is a possibility of temporary retracement to suggested support zone (0.00005010 to 0.00004200). if so, traders can set orders based on Price Action and expect to reach short-term targets.
Beginning of entry zone (0.00005010)
Ending of entry zone (0.00004200)
Entry signal:
Signal to enter the market occurs when the price comes to " Buy zone " then forms one of the reversal patterns, whether " Bullish Engulfing ", " Hammer " or " Valley " in other words,
NO entry signal when the price comes to the zone BUT after any of the reversal patterns is formed in the zone.
To learn more about " Entry signal " and the special version of our " Price Action " strategy FOLLOW our lessons:
Take Profits:
TP1= @ 0.00006260
TP2= @ 0.00007060
TP3= @ 0.00008020
TP4= @ 0.00008540
TP5= @ 0.00009580
TP6= @ 0.00012900
TP7= @ 0.00015600
TP8= @ 0.00018290
TP9= Free

A trading opportunity to buy in IOTABTCTechnical analysis:
. MIOTA/BITCOIN is in a range bound and the beginning of uptrend is expected.
. The price is above the 21-Day WEMA which acts as a dynamic support.
. The RSI is at 53.
. While the RSI downtrend and the price downtrend in the daily chart are not broken, bearish wave in price would continue.
Trading suggestion:
. There is a possibility of temporary retracement to suggested support zone (0.00005010 to 0.00004200). if so, traders can set orders based on Price Action and expect to reach short-term targets.
Beginning of entry zone (0.00005010)
Ending of entry zone (0.00004200)
Entry signal:
Signal to enter the market occurs when the price comes to " Buy zone " then forms one of the reversal patterns, whether " Bullish Engulfing ", " Hammer " or " Valley " in other words,
NO entry signal when the price comes to the zone BUT after any of the reversal patterns is formed in the zone.
To learn more about " Entry signal " and the special version of our " Price Action " strategy FOLLOW our lessons:
Take Profits:
TP1= @ 0.00006260
TP2= @ 0.00007060
TP3= @ 0.00008020
TP4= @ 0.00008540
TP5= @ 0.00009580
TP6= @ 0.00012900
TP7= @ 0.00015600
TP8= @ 0.00018290
TP9= Free


$IOTA Looks good, potential bullish flag... $IOTA Looks good, potential bullish flag...
UCTS Buy signal on the 6h/8h/12h charts.. (15%+)
#IOTA

IOTAIOTBTC start to growing
Break out resistance line of downtrend channel
After impulse forming bullish flag
RSI -ovesold - look bullish
Waiting for 61.8% level fibonacci
Target 0.00006000

#IOTABTC 5/19#IOTABTC
Buy between 4600/4350
Targets
4900
5600
6200
7100
Hold
Stop_loss:4000
Risk( Average 10%)
Invest:3%
we ask Allah reconcile and repay

IOTA showing signs of life! IOTA might be ready to make a run for it here with volume showing up past few days
We would need for it to closed above resistance and retest it as support before entering
Only then can we target local highs, which is a strong possibility if BTC starts to pullback and money flows into alts

Trying to un-tangle this messX's are usually more sideways so that's my biggest caveat with this count but w/e think IOTA A bounces here for a bit of a recovery. Will be great for the USD pair BTC pair took a pounding against BTC's rise so at best this just brings us back up a bit to where we started off.

IOTA : Upto 75% Profits Opportunity RSI : 63
Volume : In good position
Accumulation Area : 4150 sats - 4350 sats
Distribution Area
Target 1 : 4550 sats
Target 2 : 4871 sats
Target 3 : 5181 sats
Target 4 : 5390 sats
Target 5 : 5769 sats
Target 6 : 6230 sats
Stop Loss : 4032 sats
Remember to drop your LIKES and press the FOLLOW button if you are interested by our forecast and be free to DISLIKE the post or right your COMMENT if you not convinced by the forecast. Thank you for your time to read our posts anyways. With Regards.
Good Luck.
Legal disclaimer:
Information on this channel is our team's analyst's "opinion" based on data available at this point in time. These opinions are not recommendations to buy or sell securities/commodities and cryptocurrencies. Trading and investing is a risk and you should not rely on this data to make any financial decisions. You must consult a financial advisory licensed by regulatory agencies in your legal jurisdiction. All information stated here and in our reports don't guarantee any possible profits or losses. Please do consider to do your own due diligence and research when making any kind of a transaction with financial implications.
With Regards. TeamTWA.
You can give us your feed backs and suggestions on our effort in addition to this your questions here in trading view or in our telegram channel by the same name togetherweaccumulate.


Why do we fall Mr Wayne?While I had originally thought IOTA was done correcting and ready to go, I think we still got some sideways accumulation to go.
Current view on IOTA is as illustrated.
Making a Sideways flat - this is probably the B or X wave of a larger move.

Iota - Depressão finalUsando o fator gráfico psicologico, notei uma certa semelhança na iota, estando no ultimo passo de "depressão" o ativo se encontra numa cunha de alta acumulativa, no fundo histórico, ate Agosto deve acontecer um estouro da LTB, revertendo o ativo para o bullmarket
Entrada: 4.000 - 4.400
Stop: 3.800
Alvos Mid-Term:
6.160
8.000
10.000
