IOTA / Bitcoin (IOTA/BTC): Supports, Pivots & ResistencesFind Winning Trades In Seconds >> efcindicator.com (Special Discount)
IOTA / Bitcoin (IOTA/BTC): Supports, Pivots & Resistences – Short-Term
IOTBTC trade ideas

IOTA FALSE FLAGFalse Flag after classical pre reversal movement. long to for the right shoulter at least
BIO


Inversed Head and Shoulders? Inversed H&S, plus buy signal from the UCTS on the 6h chart...MACD bullish, my targets on the chart.
Please DYOR before taking any actions.


IOTA seems in a dire but yet can be in an optimistic uptrendand love this tweet too: www.zerohedge.com

IOTABTC [Daily] 8000 as key level for bulls... Looking to sellAs you can see on the chart we are right above 8000. Levels is wirking as support for now.
As long as bulls stay above there is a chance for rally towards 11000 or even 13000.
Overall we are still in a bear market so I would rather wait fro breakdown and close below 8000.
First target is at 6000.
Break and close below that level may indicate that latest consolidation within 11000-6000 and market is ready to fall towards 1000.


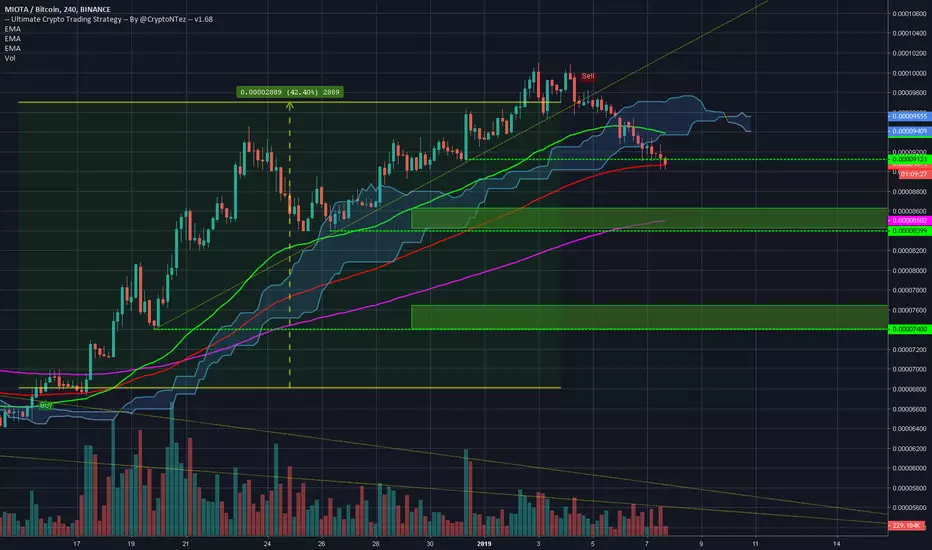
42% in one call! WHAT!Look at this run on the 4h chart. over 42% on a single signal from the Ultimate Crypto Trading script.
Amazing!.Now we are in a similar position than $ETH is,
Trying to find a support level. I have drew 2 areas where I found TD Supports + fib levels.Wait for a bounce!


IOTA: Short Term Trade Setup !!Buy after Breakout Succesfully if Breakout Fail then don't trade in IOTA.
You Can Also set Own Risk reward.
Let see what Will be Next Move.
Warning- I m Not a Financial Advisor this idea Only For Educational Purpose Only.
Thank You !!


IOT Falling for finding correctionIOTA is falling following ETH that finds the correction on support price 113$ - 120$. if support line of ETH is broke the crypto will back to 80$ again.

There is a trading opportunity to buy in IOTABTCTechnical analysis:
. MIOTA/BITCOIN is in a range bound and the beginning of uptrend is expected.
. The price is above the 21-Day WEMA which acts as a dynamic support.
. The RSI is at 73.
Trading suggestion:
. There is a possibility of temporary retracement to suggested support zone (0.0000750 to 0.00006200). if so, traders can set orders based on Price Action and expect to reach short-term targets.
Beginning of entry zone (0.0000750)
Ending of entry zone (0.00006200)
Entry signal:
Signal to enter the market occurs when the price comes to " Buy zone " then forms one of the reversal patterns, whether " Bullish Engulfing ", " Hammer " or " Valley " in other words,
NO entry signal when the price comes to the zone BUT after any of the reversal patterns is formed in the zone.
To learn more about " Entry signal " and the special version of our " Price Action " strategy FOLLOW our lessons:
Take Profits:
TP1= @ 0.00009380
TP2= @ 0.00011050
TP3= @ 0.00012950
TP4= @ 0.00014060
TP5= @ 0.00016480
TP6= @ 0.00018910
TP7= @ 0.00026760
TP8= @ 0.00031200
TP9= Free

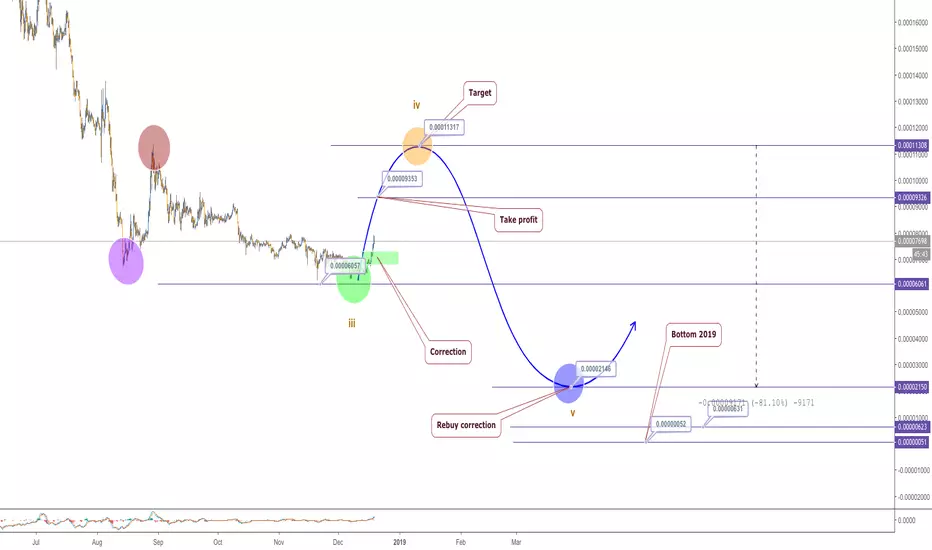
Iota...nearing a short term top?I have what I think is a fairly detailed and accurate Elliott count form the recent low. It does look like we're finishing the last wave of the much larger wave 1 (assuming the low that we recently had was the bottom...which is a big assumption).
The question is.."Where do we finish?"
I have marked up some common targets based on fib extensions of the last (red) 5 wave. Let's see if one of them is hit

IOTA, H4, Corretion and dumpWait to buy at green box, buy and take profit when done TP and TG
Warning: From the top to bottom dump 99%, and to the next corection lost 80%

IOTABTC has almost finished a crab patternIOTA always has been performing good and never disappointed, since a long period of time it is falling for the formation of crab's leg and now it is entered in buying zone and almost ready for being bullish insha Allah.
Regards,
Atif Akbar
