IOTA / BTC Bull conformation?Looks like a good entry. C&H you simply have to trade. Can fail but statistically you have to.
IOTBTC trade ideas

IOTABTC LONG. WATCH FOR RETRACE TO THIS LEVELFollow for Daily ideas in Crypto and Forex.
Original idea by Ribz


IOTA is about to do somethingIOTA is about to break downtrend
breaking the down trend will lead for a good move
don't miss it
;)

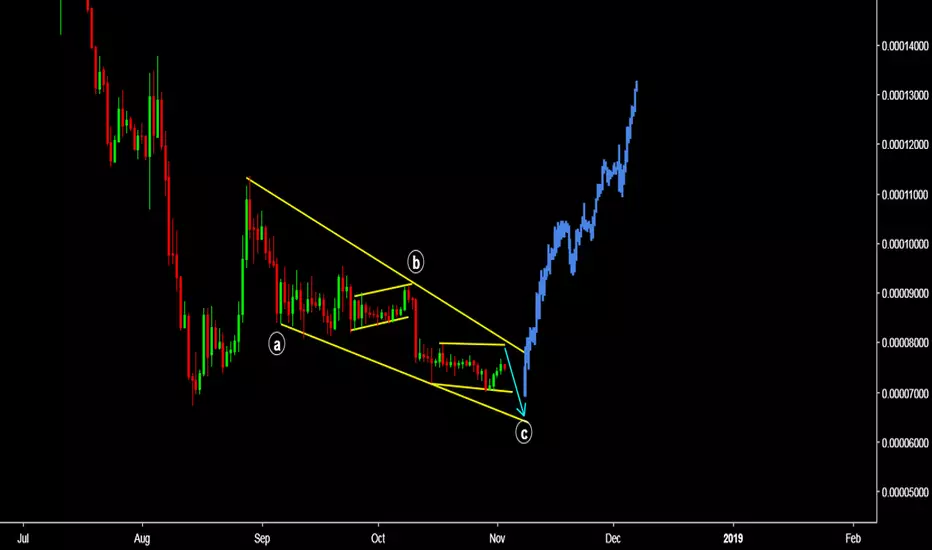
LONG IOTAWeekly IOTA shows accumulation. Preferred weekly for a clear direction. As seen its oversold and been around the support zone 0.00007100. Breakout from the weekly wedge is imminent. Hodlers can accumulate for a good swing to resistance area 0.00013000

Still in descending channel, but we are close for great entriesA possible descending triangle is forming, so more likely to go down than up. Still, there is hope since this will be one last drop if it does go down.
However, entries now with tight stop loss, are valid.
Good luck everyone ;)
**LEGENDS**
BLUE = Bear/Resistance
Yellow = Bull/ Support
~Explore the chart for possible scenarios of price actions - use zoom and scroll for better view.~
/*This information is not a recommendation to buy or sell. It is to be used for educational purposes only.*/
If you want your coin to be analysed, JUST ask.
If you got a question, ASK away!
And please keep those Stop losses in place!
Fractal dates are moments of interest, where price and time collide to create oscillation - vertical lines!
Thank you,
Ajion

IOTABTC BUYHi there. Price is on a continuation pattern to the upside. Watch strong price action at the current price for buy.
Don’t take a trade if you don’t see clearly when big guys are in.
IOTAIOTBTC
Forming the accumulative triangle under the all time low price where we can go before the next cycle moving. Stoch RSI almost overbought, Aroon trend indicator still bearish and now IOTBTC near the resistance line.
Our loss limited 0, profit unlimited. Remember about capital and risk managment!

Is this a possible senario?I count 3 levels down on the daily and seeing a W forming on the bottom . Perhaps it is time fa a reversal
There is a chance that it might get a bit lower but more or less we are reaching a bottom !


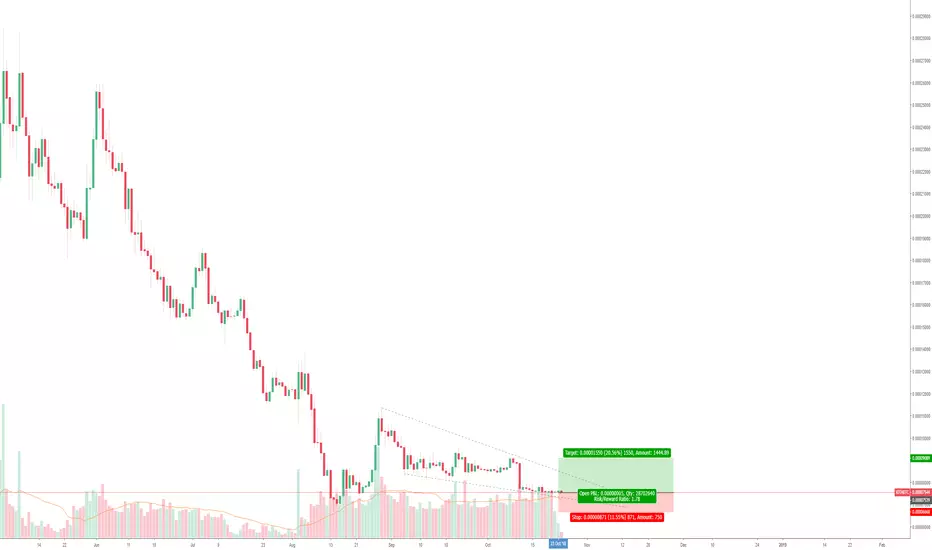
IOTA/BTC a good entry We've touched the weekly support. this is the second time we touched here, and i expect a reaction from here. targets and stoploss shown in the chart.
No reversal signs at the moment, so a conservative entry , shown with the red line, can be waited if price drops further.


iota 2_3 waek taragethey guys buy some iota in buy zone for 2_3waek
buy zone 7400_7600
sell =8500/9000

IOTA MIOTA MOON RIDE SOON! Personally, I love the IOTA, and this project is the strong with the charts & fundamentals as well!
I would love to buy around 0.00007400-7650!
using a stop loss is always necessary.
Selling targets choose for yourself.

Iota Btc Iota looking good i think it's ready. All depends on BTC if it dumps everything dumps but i'm not expecting any dump maybe small drop that's it...


25 oct -> Will iota break out its pattern and finally go up?! In the last couple of days, you see that the price moved in a consolidation pattern, which is the falling wedge. Now the question is, in which direction if the price going to break out?
Well there are a couple of things that could indicate that the price is going to break out to the upside
1. The price is at a support line
2. The last candlestick ended up in a hammer, also you see a high volume on this candlestick pattern.
3. You see that the volume is rising
Because of this, it is likely that the price is going to break out upwards. There are multiple ways to enter here, always check out if the risk/reward is perfect for you:
- When the pattern is broken, which is safer
- Buying at the support zone, which is a bit riskier
- Entering anytime soon is the riskiest
Stop loss:
- Below the support zone 0.000074996
- Trailing stop, if there is an uptrend
Target:
- See the yellow areas above
If you need any help with TA or explaining this, send me a DM!
DISCLAIMER: ALWAYS keep in mind! That this is NOT an investment advice, but an analysis. You can do whatever you want with this information, so trade at your own risks!

Iota price analysis moving forwardAs seen we are at the bottom of the downtrend hovering at strong support zones of 7300 satoshi levels and bouncing back. I sense this is accumulation happening around here and price should breakout regardless and minor + - scenario in case BTC goes haywire. T1, T2 and T3 are mentioned with a strong resistance area around 0.38 fibb levels. Please contribute if you feel what I see is a possible trend moving forward.
Thanks


IOTA - Free SignalIOTA/BTC
Buy - 7717
T1 - 8069(5%)
T2 - 8467 (10%)
T3 - 8797 (14%)
T4 - 9146 (18%)
Stop-Loss - 7461 (3.5%)
P/L Opportunity
Upside: 5 - 18%
Downside 3.5%

IOTA is showing bullish divergence on the RSI/CMF/MACD.IOTA/BTC is showing bullish divergence on the 4-hour RSI, CMF, and MACD as highlighted by the orange lines. We also got a bullish cross-over on the 4-hour MACD as well a short while ago. IOTA found support on a previous support zone that we saw it hold back in August around 7450-7500. On one of my fib charts, it is holding the .382 around 7660 pretty well so far. Risk/Reward is pretty good for this one so long as Bitcoin can remain steady.
Higher risk entry (at the .382 fib line on one of my charts): 7650-7710.
Safer entry: 7500-7600.
Target 1: 8200 (.786)
Target 2: 8900 (.618)
Target 3: 9350 (.5)
Targets were charted on fib retracement levels.
--This is not financial advice. Always do your own research and come to your own conclusions before buying/investing, as investing in cryptocurrencies comes with high risk and high amounts of volatility.
