IOTBTC trade ideas

Iota / Btc Pull back price Iota Miota it have been goin price down in acumulation for some time the break point is almost there possible bull trend price in long to 0.618 fib.
Rsi almost give the bull trend........ what you eople think :D we are open to discuss.
Manubyebye
From The crypto Zone.

IOTA BTCIota gaining some momentum its a good buy here if you want to get in early. I buy breakout GL


Trade IotaIota forming a up channel , Had a bullish divergence on the 4h scale before this little rise. Bounced on the fib line neatly. IF it respects the support line in the next few hours, has good chances of reaching the next fib line within 2 days.
This is my very first idea and i'm pretty new to trading and cryptos (started about 2 months ago), so don't pay much attention to my analysis. It's just a test. Pls leave feedback below ;)

Trade IotaIota forming a up channel , Had a bullish divergence before this little rise. Bounced on the fib line neatly. IF it respects the support line in the next few hours, has good chances of reaching the next fib line within 2 days.
This is my very first idea and i'm pretty new to trading and cryptos (started about 2 months ago), so don't pay much attention to my analysis. It's just a test. Pls leave feedback below ;)

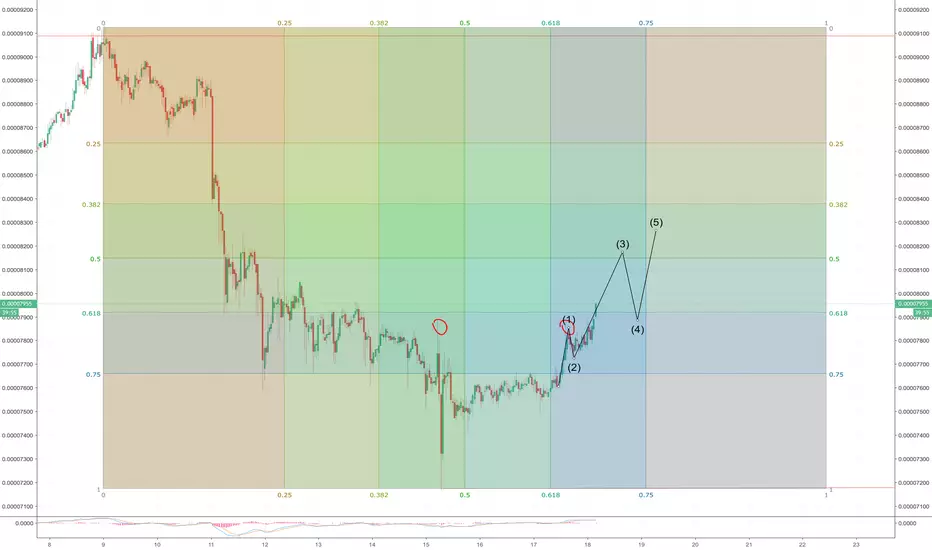
IOTA/BTC Bullish DivergenceBuy: 7750
Stop Loss: 7400
Target: 8450
Risk/Reward Ratio: 1:2
20% of your Capital

IOTA - Mid to Long term tradeIOTA 3d chart.
1. Long Long Retrace.
2. Bounced @ .00006639 then climbed to .00001139
3. Retraced to under the .786 fib
4. Formed a hammer. I am buying the Hammer,
Bullish RSI, MACD. Stoch is turning Bullish.
5. I am waiting for a slight rise followed by a pull back
and then I believe we will return to the Nick line and
will complete a double bottom pattern. At that point
I will go LONG.


Daily Bullish Signal $IOTA #IOTA IOTA/BTC (17-10)#IOTA (IOTA/BTC)
Buy : 7300-7600
Flash Sell : 8000
Short Sell : 8500
Long Sell : xxx
Stop : 6800
Follow me for more signals daily

IOTA LongIota finally stopping the bleed from btc's recent move up.
Trend bleeding has stopped, and we are now entering accumulation until levels start to squeeze.

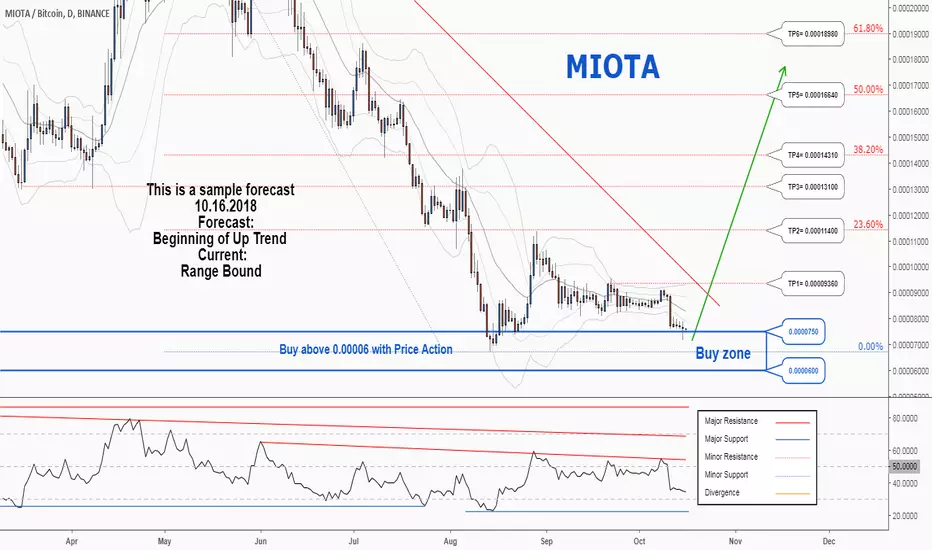
A trading opportunity to buy in IOTABTCTechnical analysis:
. MIOTA/BITCOIN is in a range bound and the beginning of uptrend is expected.
. The price is below the 21-Day WEMA which acts as a dynamic resistance.
. The RSI is at 34.
. While the RSI downtrend and the price downtrend in the daily chart are not broken, bearish wave in price would continue.
Trading suggestion:
. There is a possibility of temporary retracement to suggested support zone (0.0000750 to 0.0000600). if so, traders can set orders based on Price Action and expect to reach short-term targets.
Beginning of entry zone (0.0000750)
Ending of entry zone (0.0000600)
Entry signal:
Signal to enter the market occurs when the price comes to " Buy zone " then forms one of the reversal patterns, whether " Bullish Engulfing ", " Hammer " or " Valley " in other words,
NO entry signal when the price comes to the zone BUT after any of the reversal patterns is formed in the zone.
To learn more about " Entry signal " and the special version of our " Price Action " strategy FOLLOW our lessons:
Take Profits:
TP1= @ 0.00009360
TP2= @ 0.00011400
TP3= @ 0.00013100
TP4= @ 0.00014310
TP5= @ 0.00016640
TP6= @ 0.00018980
TP7= @ 0.00026570
TP8= @ 0.00031200
TP9= Free
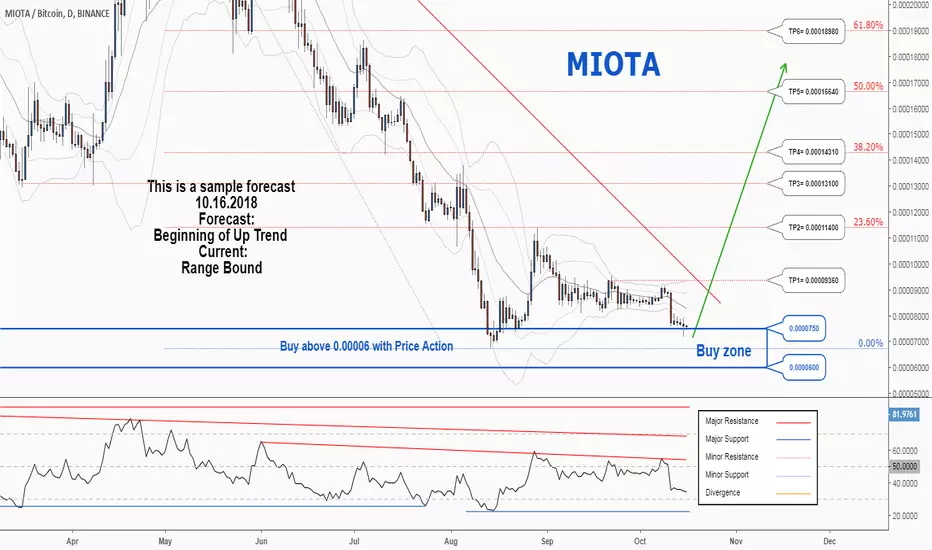
IOTA on the HorizonBINANCE:IOTABTC on strong 4hr suport. Looks really good for a nice ride here. Oversold RSI on the 4hr and crossing up. Histogram snd MACD looking bullish as well. for a 1:1 extention we'll be looking at 12500. Let's see!


Analytics IOTA/BTCAn old project with its own fast blockchain, focused on processing a large number of microtransactions and ensuring the functioning of IoT. The team has agreements with many manufacturing giants.
The asset began to gain trading volumes in early August and saves them. The coin does not show any behavior anomalies on the chart and follows the market.
Now the rate is in a zone of consolidation. Comfortable asset entry point 0,0000822-0,0000798. If the current week closes above 0.0000927, then the entry point will have to be shifted up. In spite of the big trading volumes, they are speculative in nature, the coin does not deposit in the portfolios.
Intraday trading is quite difficult, because the average volatility is about 3%. But high liquidity allows you to manage risks by exposing stop-losses.
The potential in the medium term is within 200%.
The coin is promising for long-term investments.


IOTA/BTC - Good accumulation - Next target - xuanhaimmoerWe have good sideway zone and accumulation so wait for break up or buy in lower zone and hold for target.
Analysis in the chart
Good luck and thank all guys.
Hope you like it !

Cross KST&MA Cross- Always do your own research before trading! Don't take this as a fact.
Potentional bottom touch incoming. We've a cross on both the MA & KST. Could this be true?

IOTA may bounce or fallIOTA is at the bottom of the channel and worth watching for starting its up movement. Safer to buy after the price go above 8740. Even more safer above 9000. But if BTC start rising the movement may become a breakout and it will grow faster.
Stop loss below 8450. If falls you may catch it later at 8300 or 8150.

