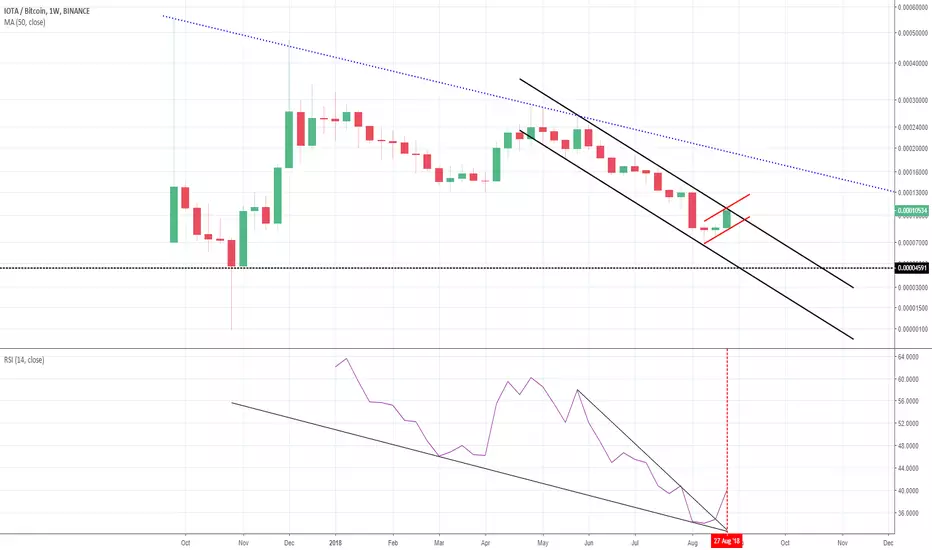
IOTA - Volume Increasing - Inverse Head & Shoulders - Short Term- IOTA has formed an inverse Head & Shoulders
- Volume has increased
- RSI looking Bullish
Targets:
- My Buy Zone: .00008825-.00008835
- My Sell Zone: .00009005-.00009190
As always take caution in Trading your money. Do your Due Diligence and in no way is this financial advice! This is my target zone for when I will buy if the targets are hit.
IOTBTC trade ideas


Opportunity to go long
Main Support Level: -5%
Main Resist Level: 5%
Trend: Reverse pattern
Strengh from Support: Medium
Divergence occurs: low

$IOTA, Otra Ves…
Weekly
Looking at our trend timeframe we see price has found support at 7000 satoshis, stochastic rsi showing momentum is shifting towards the upside. Will be watching smaller timeframes for a reversal, a close above resistance and expect a radical push towards 15000.
Daily
Shifting over to our pattern timeframe we see price has broke out of its minor downtrend and formed a higher high. Stochastic RSI showing momentum is looking for support, price has formed a higher low at 9000. A daily close above 9500 and expect a higher high to form near 13000, however if rejected at this level expect a sell off towards 7000.

Potential up swing after a formed higher lowIn iota's history we had 3 formed higher low's (marked by the red lines) and every time at least +100 %.
A 4th formation has just formed. The chart looks bullish at the moment but we have to consider that the market leader bitcoin still looks bearish. So i will wait a couple of days if the higher low is confirmed and bitcoin finds strong support its time to buy!
Dont forget to take profits at the resistance lines!

0.618 reached. time to go downAs off right now it looks like we've hit our max and it's about to get time to go down. Wouldn't pick the buy side until confirmed break on the upside.

IOTABTC (request analysis)IOTA reach support zone at triangle support and fibonacci 618 support.
We can buy this coin and aim for :
A. 53% profit target at classic support and resistance at 0.00013148
B. 93% profit projection at triangle projection at 0.00016470

IOTA/BTC with 2 support lines.IOTA is in Falling Wedge formation, which should be a bullish one if price break that upper resistance line.
To catch another bullish move is to buy IOTA at Wedge lower support line. It may be between 5500 and 4750 sat. (depends where it will hit).
It can have an upward bounce at 6800 satoshi, but that second line at around 4750 is a better one in my opinion. As it's either a strong support line and it's close to Wedge lower line.
-----------------
DISCLAIMER
I’m not a certified financial advisor nor a certified financial analyst. The contents posted by me are for informational and entertainment purposes only. Don't follow any analysis blindly, and make your own decisions. Always plan your trades and play with stop-loss.
If you like my charts, follow me on Twitter or Steemit.

Technical Analytic for #IOTA (06-09)This is a risky call. So if you can't pay attention all the time, Don't get entry
We can hope IOTA follow the H&S form
#IOTA (IOTA/BTC)
Buy : 8500-8700
Flash Sell : 8800-8900-9000-9100-9200
Short Sell : 9300-9400-9500-9600-9700
Stop : 8300
Follow me for more signals
Inbox me for more signals

Small bounce trade on strong resistance after abcde correction1h divergence and hits strong resistance. Might want to use a tight stoploss and take profit early. 1h divergences don't create big bounces.

Analytics IOTA/BTCThis pair does not observe any anomalies on the general background. Trading volumes are average, did not increase compared to summer. This may indicate a loss of interest in the asset.
Today, IOTA fell 5% against the backdrop of news on the BTC, and then returned to its channel. Wait until the day closes to clarify the bitcoin situation before making a decision to open a position, IOTA rates are completely correlated by BTC.

Simple IOTA trading setupThis is not a financial advice. Trade on your own risk.
This trading setup is based on Bull flag pattern, 5 corrective waves and RSI bullish divergence

There is a possibility of the beginning an uptrend in IOTABTCTechnical analysis:
. IOTA/BITCOIN is in a range bound and the beginning of uptrend is expected.
. The price is above the 21-Day WEMA which acts as a dynamic support.
. The RSI is at 52.
. The RSI downtrend & The price downtrend in the daily chart are broken, so the probability of the resumption of an uptrend is increased.
Trading suggestion:
. There is a possibility of temporary retracement to suggested support zone (0.000096 to 0.000082). if so, traders can set orders based on Price Action and expect to reach short-term targets.
Beginning of entry zone (0.000096)
Ending of entry zone (0.000082)
Entry signal:
Signal to enter the market occurs when the price comes to "Buy zone" then forms one of the reversal patterns, whether "Bullish Engulfing" , "Hammer" or "Valley" in other words,
NO entry signal when the price comes to the zone BUT after any of the reversal patterns is formed in the zone.
To learn more about "Entry signal" and the special version of our "Price Action" strategy FOLLOW our lessons:
Take Profits:
TP1= @ 0.00011100
TP2= @ 0.00013100
TP3= @ 0.00014200
TP4= @ 0.00016400
TP5= @ 0.00018600
TP6= @ 0.00020400
TP7= @ 0.00023500
TP8= @ 0.00028200
TP9= @ 0.00034000
TP10= Free

IOTA - watch for entry over next 3 - 6 daysIOTA has turned the corner and appears to be on an uptrend again. It currently looks to be in an ABC correction, which I don't think has been completed yet - whilst the 4 could be where marked and we go up from here, I think more likely the 4 will be put in lower down. Based on the count given, we could see this come back to the 0.5fib around 9.3k sats, or I think more likely down to the 0.618 around 8.9k. If it drops below 8.7k then the count given is invalid and we could see a retrace on the whole move to the low 8k's. If the count is proven valid by a turn at the 0.5 or 0.618 then we can target up to the 1:1 extension (12.8k) - or perhaps even further to the next major resistance in that range around 13.7k for a possible 50%+ gain.
As always, it all depends on BTC behaving.

IOTABTC buy scenario! Hello my Crypto friends!
Today I'm going to look at BINANCE:IOTABTC at 1h timeframe. IOTA broke the downtrend with strong impulse. As you can see, IOTA is in the correction. I think this correction will be over soon. In this correction I can see two completed waves. I can see divergence between first and third waves what can be a god sign for a reversal. Be careful, it can go lower to -0.27 or -0.618 fib level and from there it can reverse. This is the reason why i will wait for the break and the flag before the buy. So keep an eye on it, be patient & trade with care!
REMEMBER: I'm only interesting in the buy!
So, please don't jump in buy to early, patience is the key!
If you want i will do update on this pair!
Don't forget to hit the like/follow button and write comment!
So keep an eye on it, be patient & trade with care!

BUY BUY BUY!! PRICE CLOSE TO APEX.Triangle in an upwards trend.
Close to APEX.
High chances of breaking upwards.