IOTA downtrend continues, rebound in sight?Looking at the daily we can see it is continually dropping. The past 2 days it has stabilized. We are testing low levels not seen since early December and March 17. It was at both of the times that IOTA went on a bull run. We are also approaching what happens to be 134 day cycles. It will be interesting to see what happens from here, I personally am Bull.
IOTBTC trade ideas

$1k to $100k Challenge - Day 13 Trade #20 - IOTAHello all and thanks for stopping by and following my personal challenge. I am attempting to turn $1000 into $100,000 by the end of the year by day trading altcoins.
I started my challenge on July 14th with a bankroll of 0.16 Bitcoin that was valued at $1000 at the time. You can follow and see all my trades in my profile.
The first week, I made a few mistakes that cost me. Being greedy never pays off.
Last 9 trades: 7 wins 2 loss
After 12 days and 19 trades:
Wins: 12
Loss: 7
Balance: 0.1878 B
USD: $ 1551
There are too many trades to list. All my trades and stats for this challenge can be found in the link on my profile if you want to follow.
CAUTION: This challenge represents a small portion of my overall portfolio. To maximize the potential of reaching my 100k challenge goal quickly with just 1k, I am using most of my challenge bankroll per trade trying to build up my bankroll for the challenge.
If you are following me, I do not recommend this strategy, but instead please limit your trades to less than 3-5% of your portfolio. Please trade smart.
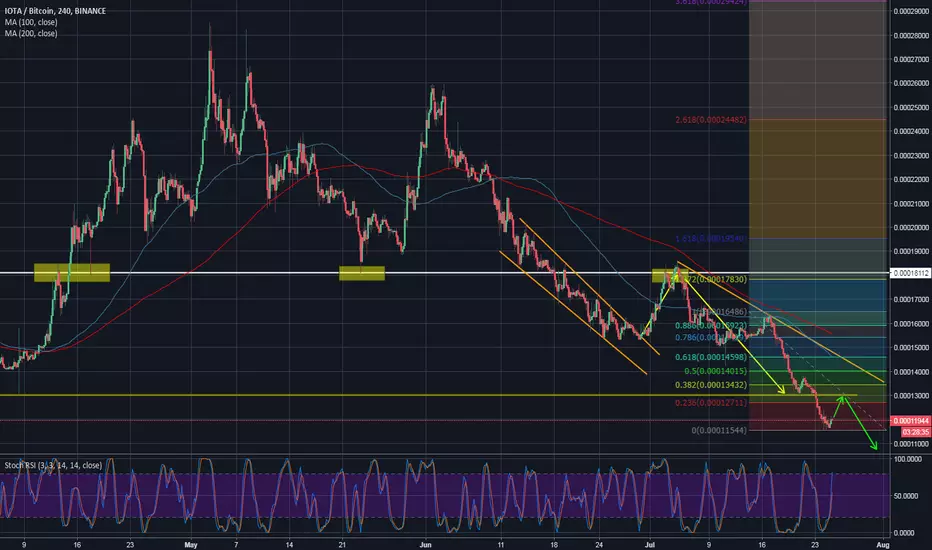
Alright, here we go with Day 13 trade #20
I invested 0.10 B into IOTA. I bought 789 @ 12670 satoshi
Sell target is: 13303 for 5% profit
Stop loss: 12100
I will be laddering my sell targets to protect profit.
In case you are wondering why my buy price sometimes doesn't match the current price on the chart when I make a new post, this is because I post my coin selection to my Discord group first and then make a new trade idea here which takes about 30 minutes to complete this all.
Your comments, agrees and disagrees are always welcome and appreciated.
Thanks for stopping by and have a great day!

IOTA Maintaining TrendChannel Breakout following moderate uptrend.
Resistance seems to be at 0.00013002, if passed, could see additional pressure at 0.000133303 from Redking's challenge play & followers (Profit/Loss range set based on challenge play)
*Not professional advise, always trade at your own risk.

IOTABTC SwingMy first idea here, be civil.
IOTA has been selling off for almost 3 months, and looks ready for a reversal.
Bounce off 11,500 sats looks good. Horizontal candle body high shows positive support at 12,000 - 11,200 sats.
50% Fibonacci retrace shows 20,000 sats as the measured move.
Both Stoch RSI and MACD looks ready for positive momentum.
STOP LOSS: 11,200 - 11,000 sats.
Set up alerts on price action, don't get stopped out by a squeeze, move stop loss as needed.
More to come, thanks for reading.

IOTA: AUDI COLLABORATION - PROFIT = 10.11% !!!Our "Crypto Bottom" Trade Signal has correctly identified a buy in point on the 24th of July 2018.
Using this buy in point and selling at today's peak price as identified by our NEW "Crypto Peak" Trade Indicator, you would have expected to net 10.11% PROFIT!!!
The increase in price may also be explained by positive developments including:
April 20: Fujitsu is set to introduce IOTA at the Hannover Messe trade fair in Germany this month. A Fujitsu Full Node that is connected to the first K5 Enterprise IOTA full node will be unveiled at the event.
April 20: The IOTA Foundation (IOTA) and InnoEnergy Scandinavia (InnoEnergy) signed a Memorandum of Understanding coming into effect this month. The two parties will collaborate on the development of smart community solutions and business model innovation
April 21: Fujitsu full node demonstrated at Hannover Messe trade fair in Germany. This allows for machine to machine payments and secure component tracking between robots.
April 30: IOTA Snapshot outline. This aims to reduce the size it takes for nodes to save the entire Tangle (to disk).
May 1: IOTA Ecosystem website is released. This includes an IOTA Development Fund that provides financial support to developers who make use of the IOTA platform.
May 2: IOTA Foundation (IOTA) joins Bosch, Groupe Renault, BMW 4.20% -0.36% , Ford, General Motors, ZF 0.30% 0.09% , and other mobility and Distributed Ledger Technology ( DLT -0.68% -2.82% ) leaders to form a new mobility industry consortium fostering joint development of DLT -0.68% -2.82% standards, pilot projects, and open source software tools.
May 2: Forbes publishes article on IOTA's price rise.
May 3: IOTA Foundation is excited and proud to start the official unveiling of Qubic
May 3: Huobi to list IOTA.
May 17: Kontakt. io , the leading IoT 50.00% 50.00% (Internet of Things) location platform provider, announces collaboration with the IOTA Foundationt.
May 23: IOTA announces collaboration with the UN.
May 30: IOTA announces the release of it's Trinity Wallet for IOS and Android.
June 7: BitPanda lists IOTA.
June 22: IOTA and SinoPac team up to collaborate on digital innovations in the financial sector. SinoPac is one of the largest Taiwan-based financial holding companies which operate through the Asia Pacific
June 23: TipSection algorithm operates at 20 CTPS after IRI v1.5.0 was released.
June 25: BitPanda partners up with the Austrian Post to allow IOTA to be purchase for cash at over 400 Austrian Post Office branches.
July 8: IOTA participates in the first European smart city consortium (called +CityxChange). The consortium project will receive 20 million Euros in funding by the European Research and Innovation programme Horizon 2020.
July 26: Audi Think Tank & IOTA Foundation collaborate to explore Tangle-based mobility use cases.
The general uptrend in the crypto markets as well as the positive developments outline above.
***The "Crypto Bottom" and "Crypto Peak" crypto trading used in this analysis is included as part of the Crypto Trade Signals subscription.***


IOTA/BTC 4H Candle | Trading off Heikin Ashi Candle Strategy*** Technical Analysis***
1H showing 3 green candles. IOTA has been down trending for awhile now. Chart shows only one time in the last few weeks for profit earnings. Last huge profits were on 1-5 July 1D chart. The 4H is showing signs trend change. Will monitor this for entry and enter on the next bull candle. Stoch-RSI and MACD also have bullish signs indicating that an uptrend is about to commence.
***Re-occurring Notes**
I like starting off at the 1hr to see a potential trade brewing up, then move to 4h to enter trade. Other Ashi traders like to buy and sell only on the 1D. It's up to you based on your free time how much you can pay attention to the charts. Usually when 1 Day is green, all time frames underneath are as well. Same goes for Red candles.
STOPLOSS: According to the Heikin Ashi Strategy, Stoploss is set just below the wick of the first bullish candle. When it comes to higher tiemframes, You never have to worry about stoplosses. On the 5min time, I found that stoplosses are triggered often.
STOCH-RSI: PointIing out with the green arrows that Stoch RSI is uptrending in every entry and stars its down trend when correction is ongoing. These other indicators are also beneficial when predicting when price will fall.
----------------------------------------------------------------------------------------------------------------------------------------------------------------
***Heikin Ashi Trading Rules***
ENTRY: wait until the script signals for a green trend change candle(small bodied candle with up & down wicks). you will see a green arrow underneath.
Now waited until the second green candle(wick on top) to form before entering into position. This is confirmation of trend change.
EXIT: Wait for a red trend change candle signal, sell at the next red candle with wick on bottom. If you want to take profits on the first red, it's up to you.
----------------------------------------------------------------------------------------------------------------------------------------------------------------
***Advice***
Using bigger time frames cuts out all the trading noise. For smaller time frames(5min), I found it beneficial to also use Stoch RSI, MACD, Vol, MA Cross indicators to confirm entries so that you're not constantly trading in and out. I would advise against trading on the 5min using Heikin Ashi Strategy, It's just too tedious and time consuming.
Stay Disciplined and you shall be profitable. Don't chase the trades, Let them come to you. If you miss out, there's plenty more opportunities. Wait for the next trend change. This technique can be applied o all Alt coins as well. Keep in mind though that alts tend to follow Bitcoins movements. Patience is key
------------------------------------------------------------------------------------------------------------------------------------------------------------------
***HEIKIN ASHI TECHNIQUE - My thoughts while learning this trading style***
If you would like to learn how to trade off this technique, go to the link below by trading strategy guides. This style makes trading comfortable and relaxing if you trade in the bigger timeframes, 4hr & 1day. For more price action and to gain more satoshi/USD out of the trades, trade in smaller time frames from 5min, 15min, 30min, & 1hr. I will tell you, if you're a busy person in your everyday life, trading on the 5min and 15min is not ideal.
Credit for the Script goes to BOBTARHEEL - www.tradingview.com
Script- HOW TO ADD: go to link and add to favorites, then go to indicators and search for HA COLOR CHANGE, add indicator. For alerts, go to alerts and choose HA COLOR CHANGE in the drop down menu.

IOTA breaks key supportAs we correctly predicted on July 2, the IOTA performed a perfect re-test pattern and continued its downside move. The coin first moved out of the wedge and pushed higher after the consolidation move. Then it raced to the key horizontal resistance line, previous support, peaked above the resistance line two times before rotating back lower as it was unable to close above the resistance line. Usually, when you test support/resistance two times and the result is a failure, a strong move accompanies the following price action. The price then pushed lower in the first wave, created a minor correction, and then went almost vertically down to the key support zone around 0.0001300, the line that provided support to the coin two times in the past. IOTA again reacted from this level and bounced but the bearish force is too strong at the moment and we saw brake of the support and a close well below it.
In the same manner, we expect the coin to consolidate below then return higher to re-test the previous support. Given how strong support acted before, it is to be expected that the coin will fail and rotate back lower.
IOTA Sort positionWe are moving in falling wedge. I showed all targets and stop loss. We still moving in down trend

IOTA - Free SignalYellow = Buy zone
Green = Sell Targets
Red = Stop Loss
Tweezer bottoms (Green Box) - Reversal pattern
Falling wedge - Reversal pattern
Stochastic RSI low. Bull Cross
RVI - Need to break resistance to confirm continued momentum upward.
Smaller timeframes are overbought which should pull the price back within to buy range before continued upward action.

[IOTA/BTC] IOTA - Falling wedge formation ~50++ return possible!IOTA is forming a nice falling wedge pattern -- %50+ return possible.
Breakout will happen in the next few days, or weeks.
Fill up your duffle bags my friends!

possible pump incoming same timing,
usually in crypto the patterns repeat at least twice..... so BUY
IMHO

The end of the patternThis wonderful asset is at the end of the second triangle. At this stage there are two options: to fall to the bottom of the first triangle or to reach the resistance line of the two triangles (the purple line).
If we had asked that question a month ago, we could probably guess it will drop down, but due to great Bitcoin uptrend, it's now hard to say the exact direction, we should wait another 2-3 days for the answer.

$IOTA/BTC ~ Bouncing off long term support.After $IOTA released their marketing video today, I wanted to see the cross reference between the fundamentals and technical analysis for a coin thats usually so quiet. And, as you can see they've timed this video nicely to support the technical analysis crucial point of bouncing off a long term support. I've personally taken a position in this trade from 0.00013000 with multiple entries all the way up to 0.00013500.
I believe we'll see a nice uptrend follow from here. My stop loss is in place under the support just in-case Bitcoin's actions cause a sell off.
Trade safe. Average in/out. Use stop losses.

IOTABTC opportunity for buy!Hello my Crypto friends!
Previous BTCUSD analysis work perfect. Take a look, and hit the like/follow button!
Today we are taking a look on IOTABTC, but at 1h timeframe BINANCE:IOTABTC . IOTA broke 1h downtrend and making flag for confirmation. At this timeframe we can see 1h divergence what could be a good sign. So, take that breakout with your own tested strategy and take some profit by moving your stop, because we are still in 4h downtrend. If i see corrective move similar to previous one (in ellipse) then i will expect one more move down, but i will update the charts!
REMEMBER: We are only interested in the buy!
If you want i will do update on this pair!
Don't forget to hit the like/follow button and write comment!
So keep an eye on it, be patient & trade with care!

IOTA/BTC possible great setupIOTA in pair with BTC shows a falling wedge pattern and huge support just here. It looks like a really good setup for a trade.
Of course there is a lot of fundametlals changing the game, like ETF supporting "only BTC" and leaving alts behind. If IOTA braks the support zone, the pattern is crashed of course. But our tasks is to find really good trades. This is one of them.


IOTA - Adam and Eve Double BottomWe can see a repeating pattern of a falling wedge followed by an adam and eve double bottom, looks to be completing the eve bottom now and looks to be a good buy.
IOTA
BUY: 0.000154 - 0.00016
SELL:
0.00017
0.00019
0.00020
0.00023
0.00026
0.000275
0.00033
STOP LOSS:
0.00013

IOTA BTC falling wedge thoughtBINANCE:IOTABTC
Just an idea I see as of now. price can go down until it can go up again.
I am no professional, I am just a random person here learning as a go.

IOTABTC Waveform SpeculationsMade this for a friend so thought I'd share (not financial advise). IOTA / IOT has formed a pretty convincing bottom which would indicate the beginning of the next wave cycle, though this should be confirmed by trading volume... which at this point hasn't really been confirmed. I'd keep a tight stop loss just below the previous low point as inidicated on the fibbonaci level also. There is clear resistance ahead but if the price can break through this level we could see a bull reversal formation, which would also need to be confirmed by trading volume. If the price does break above this level and hole, then I would consider adjusting the stop loss to the current resistance level in future.

IOTA 7/16 Prediction
RSI divergence is indicating a turn in trends
Cross and bounce of MACD also shows beginning of upward trend
Price bounced off of support line, after consolidation should expect continued upper trend, at worst it reaches a resistance line and reverts
Good buy with a good stop-loss

IOTA - Free SignalYellow = Buy Zone
Green = Sell Targets
Red = Stop loss zone
If you choose to use this information as a trade opportunity I do not recommend buying in above the buy zone. Let the price come to you and be patient. Trade safe!
Due the overall market action there are many falling wedges taking place on the daily charts.
The stochastic RSI and RVI in conjunction signal that the price has room to fall and the volatility could lessen as well. If the price falls then generally the volatility will lessen which leaves room for buying pressure to move back in.
I would expect a continued drop over the next few days in price and between the 15-18th we could see the price reach it's first potential breakout point at A. The support here is reinforced by the fib level as well as psych support.
If the support labeled at A does not hold then I would expect a bounce at the next level labeled at B.
Furthermore, there could be an upcross from the Chikou span in the next 7-10 days.
Time projection for price to reach supports.
Support A: 7/14 - 7/18
Support B: 7/21 - 7/25
Targets could take up to 2 weeks to be reached after that.

Undecided market in iota
this is a pattern that I have found and I will test it .. I will probably wait for the confirmation iota of at least 2% after point of entry in the arrow ...
Do not take this as an investment tip, I just '' study and train ''.
