IOTBTC trade ideas

Perfect Wyckoff accumulation at point of maximum opportunityThe Wyckoff Accumulation theory can be seen in action for IOTA, with the price range having just entered into phase C marking the point of maximum opportunity. Here I break down both the key phases and price levels, and how IOTABTC is so far following this to a tee. Should this play out according to Mr Wyckoff, a potential 400-500% increase should be about to begin.
Phase A
PS - Preliminary Support: following a prolonged downturn buyers step in, indicating that the downward trend may be nearing its end. Further confirmation seen with a volume spike.
SC - Selling Climax: selling pressure climaxes with panicked retail investors absorbed by large scale investors.
AR - Automatic Rally: the initial wave of buying defines the accumulation trading range.
ST - Secondary Test: a bottom is confirmed with a revisit to the SC (with low volume)
Phase B - multiple visits to the ST and AR are seen during this phase as we move within the trading range. Occasionally these may wick outside the trading range to close shorts and longs entered on tight stops.
Phase C
Spring - price moves below the ST (the low of the trading range) for a final shakeout as large investors mislead the public about the future trend of the market, giving them an opportunity to accumulate more at a bargain price.
Test - Large investors test market support at key levels - if a large supply is found the market is likely not ready for a move up. However once good support is found, higher lows will be seen.
Phase D
SOS - Sign of Strength: a strong price increase on high volume.
LPS - Last Point of Support: the low of a pullback after each SOS, as previous resistance becomes support. Despite the name, there can be multiple LPS.
BU/LPS - Back-up: when a new trading range is introduced prior to another substantial move up.
Phase E - price rises up beyond the PS (preliminary support) marking the end of the accumulation phase.
With IOTA currently entering phase C, potentially forming a spring (and with Bitcoin approaching strong resistance on market dominance), this may well represent the point of maximum opportunity - though as ever, ensure to set a stop loss in case the spring has not yet reached its own bottom. Alternatively, keep an eye on IOTABTC and look out for a post-spring test or SOS as further potential entry points. This a long term trade, with the full 450% move to take until early-2022.
Please give me a thumbs up and follow me if you found some value in my analysis - this is the best way you can show support and is very much appreciated.

$IOTA, Showing strong volume levels $IOTA
Showing strong volume levels as its crossing above ~1600 sats resistance level..
UCTS bullish across almost all timeframes as well..
Willing to see if its able to keep the momentum and try to reclaim '19 lows (~2200 sats // ~30%)
#IOTA

IOTA before Monster Breakout!IOTA has not the best standing in crypto space, but I think 2021 will become the IOTA ("Blockchain 3.0") year...With Crysalis 1.5 in Q1 everything will change because of the improvements of the protocol! For more informations you should follow IOTA and IOTA Archive on Twitter!!!
Because of correlation and many coins were hitting ATH, I think IOTA will hit ATH too. If not, it's a good trade setup for 2021.
Buy Today < 0.5$
SL: 0
TP: ATH > 5$

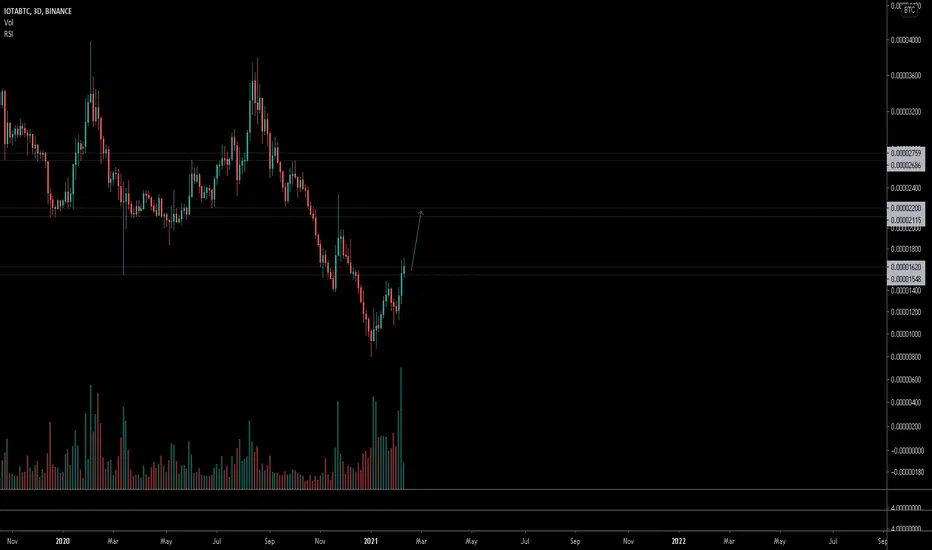
IOTA BTC A chart from heavenI know it's about opportunity costs right now. So many alts are positioned super sweet vs usd AND vs btc as well. To name a few (the ones I have in my portfolio, yeah I am biased, a little ;-)): LINK, ADA, NEO, EOS, BNB, XLM etcetera etcetera. Iota has not gotten much love recently. It deserves some love right now in my humble opinion.
This is a chart which shows sooo much upwards potential, I had to bring it. Not much time right now, trading myself, I will clarify AND update later on. Look at trendlines, a massive confluence of textbook bottom lines, look at the nice RSI divergence as well. Ma20 crossed the ma50 (the latter is about to flatten). 75 percent sure a big winner.

IOTA LONGDon't miss IOTA looking for higher support after Chrysalis Upgrade provides significant fundamentals
Resistance will dwindle as informed traders scoop up supply
Easily 2x in the next week

IOATBTCIOTA broke out trendline and bullish impulse took price to the nearest resistance at 1570. Next at 1790. Good pullback buy zone 1350 / 1230.

IOTA,If it breaks the red area, it can quickly come to the blackIf it breaks the red area, it can quickly come to the black area


IOTABTC - Long - Potential 10.56%IOTABTC - Long - Potential 10.56%
Entry- 1208
TP1- 1257
TP2- 1337
SL- 1142
- BTC - BTC PRICE Decrease, BTC DOM Decrease = ALTS Stable
- RR - 1.9
- Trailing Buy - 1%
- Trailing Profit - 1%
- Trailing Stop-Loss - no

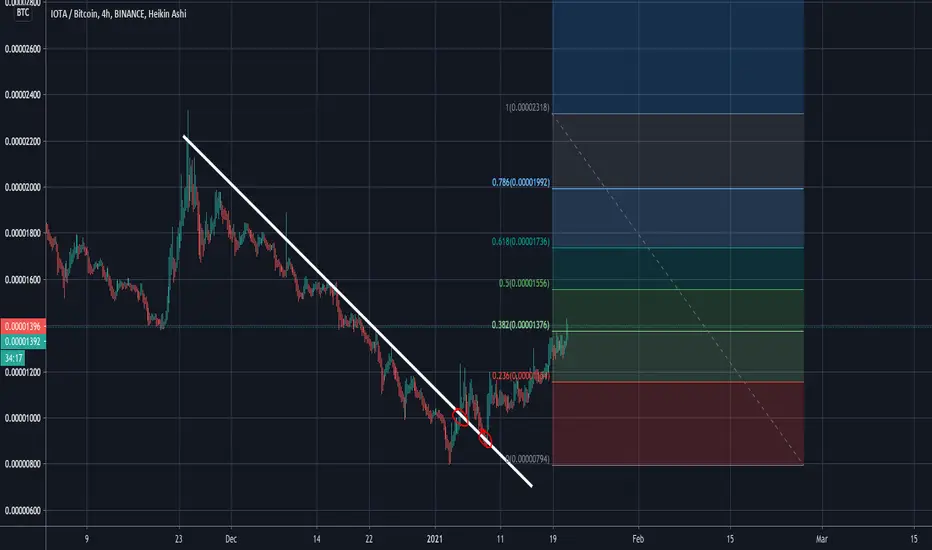
Crypto|IOTA/BTC|LongLong IOTA/BTC
Activation of the transaction only when the blue zone is fixed/broken.
The idea is to work out a large level of trend resistance of a triangle.
* Possible closing of a trade before reaching the take/stop zone.
+ Maybe right now we will go even lower, then it's okay, the idea is not activated and simply canceled.
The "forecast" tool is used for more noticeable display of % (for the place of the usual % scale) of the price change, I do not put the date and time of the transaction, only %.
Blue zones - activation zones.
Green zones - take zones.
The red zone - the stop zone.
Working out the stop when the price returns to the level after activation + fixing in the red zone.
Orange arrow - the direction of take.
Blue arrow - neutral scenario without activating the trade.
The red arrow - the direction of the stop.

IOTA/BTC [still bearish :(]Iota, one of the most hyped coins in europe.
The Trend does not show any sign of strength.
THIS does not mean that it will not bounce in future but we have no technical momentum form where we can define our risk and ride a momentum wave.
To trade sth like iota means to pay with big opportunity costs because u miss out on bigger opportunity (other altcoins)
all we can do here is defining the pivotal Support/ressitance level. as soon es price reclaims the range low with confluence of diagonal break we could see a long opportunity to range high at least.

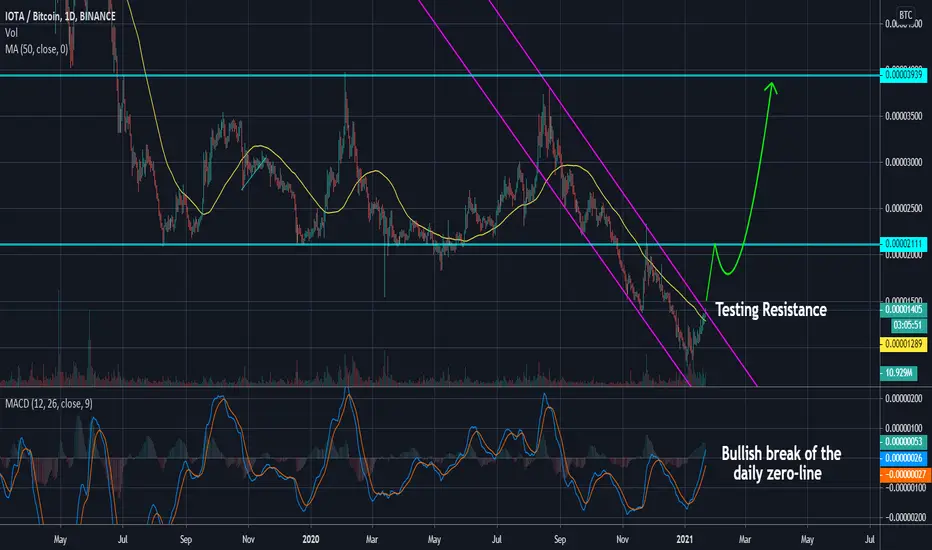
IOTA - Testing Resistance, 50%+ gains in the works!Take a quick look at the daily chart for IOTA/BTC. The price has been in a descending channel since August of 2020 and lost 79% of its value. But since then, the price action has shown a strong bullish reversal taking out the MA50 and is now testing resistance. If we can break out here, I could see the price jumping very quickly. The MACD has cleared the zero-line which is also bullish, especially on the daily time frame. Get ready!
IOTA IOTA formed a bullish triangle with the potential to break out the resistance line up
Best regards EXCAVO

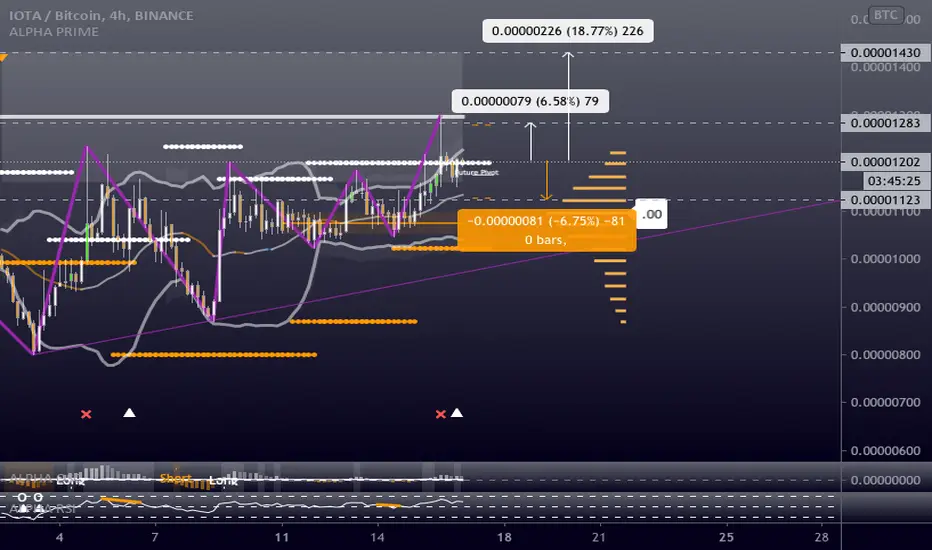
IOTABTC - Long - Potential 18.77%IOTABTC - Long - Potential 18.77%
Entry- 1206
TP1- 1283
TP2- 1430
SL- 1123
- Key Notes - High Risk at the moment - Raise S/L at TP1
- RR - 2.78
- Trailing Buy - 0.5%
- Trailing Profit - 1%
- Trailing Stop-Loss - no


iotabtc breckoutThe price is accompanied by a divergence in the bottom of the descending channel as well as the bottom of the triangle it forms. Soon the price will rise To the ceiling of the process and then we see its failure

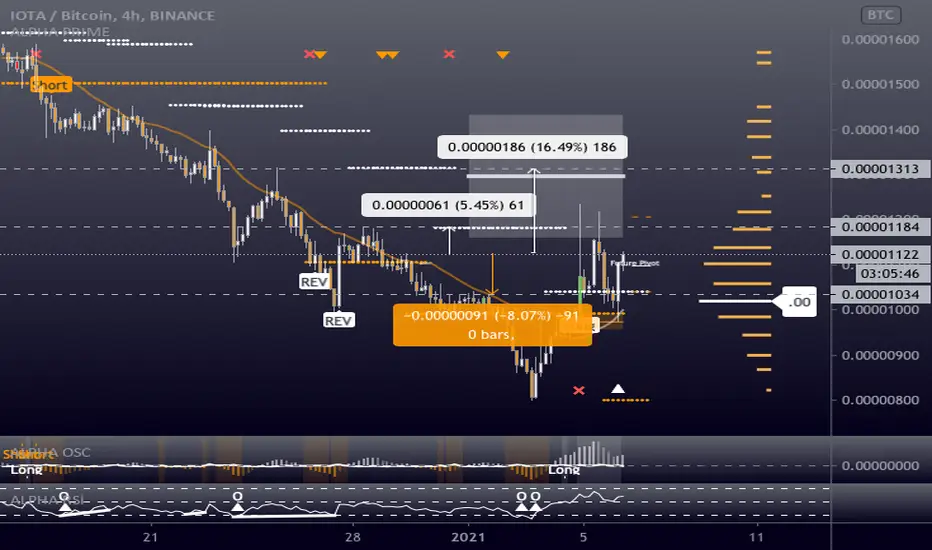
IOTABTC - Long - Potential 16.49%IOTABTC - Long - Potential 16.49%
Entry- 1120
TP1- 1184
TP2- 1313
SL- 1034
- BTC - Volatile as ever. Manage trade.
- RR - 2.04
- Trailing Buy - 0.5%
- Trailing Profit - 1%
- Trailing Stop-Loss - No