IOTA/BTCAccumulation: Wyckoff Events
PS—preliminary support, where substantial buying begins to provide pronounced support after a prolonged down-move. Volume increases and price spread widens, signaling that the down-move may be approaching its end.
SC—selling climax, the point at which widening spread and selling pressure usually climaxes and heavy or panicky selling by the public is being absorbed by larger professional interests at or near a bottom. Often price will close well off the low in a SC, reflecting the buying by these large interests.
AR—automatic rally, which occurs because intense selling pressure has greatly diminished. A wave of buying easily pushes prices up; this is further fueled by short covering. The high of this rally will help define the upper boundary of an accumulation TR.
ST—secondary test, in which price revisits the area of the SC to test the supply/demand balance at these levels. If a bottom is to be confirmed, volume and price spread should be significantly diminished as the market approaches support in the area of the SC. It is common to have multiple STs after a SC.
Note: Springs or shakeouts usually occur late within a TR and allow the stock’s dominant players to make a definitive test of available supply before a markup campaign unfolds. A “spring” takes price below the low of the TR and then reverses to close within the TR; this action allows large interests to mislead the public about the future trend direction and to acquire additional shares at bargain prices. A terminal shakeout at the end of an accumulation TR is like a spring on steroids. Shakeouts may also occur once a price advance has started, with rapid downward movement intended to induce retail traders and investors in long positions to sell their shares to large operators. However, springs and terminal shakeouts are not required elements: Accumulation Schematic 1 depicts a spring, while Accumulation Schematic 2 shows a TR without a spring.
Test—Large operators always test the market for supply throughout a TR (e.g., STs and springs) and at key points during a price advance. If considerable supply emerges on a test, the market is often not ready to be marked up. A spring is often followed by one or more tests; a successful test (indicating that further price increases will follow) typically makes a higher low on lesser volume.
SOS—sign of strength, a price advance on increasing spread and relatively higher volume. Often a SOS takes place after a spring, validating the analyst’s interpretation of that prior action.
LPS—last point of support, the low point of a reaction or pullback after a SOS. Backing up to an LPS means a pullback to support that was formerly resistance, on diminished spread and volume. On some charts, there may be more than one LPS, despite the ostensibly singular precision of this term.
BU—“back-up”. This term is short-hand for a colorful metaphor coined by Robert Evans, one of the leading teachers of the Wyckoff method from the 1930s to the 1960s. Evans analogized the SOS to a “jump across the creek” of price resistance, and the “back up to the creek” represented both short-term profit-taking and a test for additional supply around the area of resistance. A back-up is a common structural element preceding a more substantial price mark-up, and can take on a variety of forms, including a simple pullback or a new TR at a higher level.
IOTBTC trade ideas

This fractal on IOTA BTC is just perfectThis looks like a good buy level on IOTA. The yellow highlighted Fractal.

LONG IOTA/BTCBuy - 0,0000157
S/L - 0,0000139
TP1 - 0,0000167
TP2 - 0,0000189
TP3 - 0,0000200
TP4 - 0,0000210


Iota BTC - LONGTime for a change in a trend direction. RSI on daily seriously oversold - first signs of bullish divergence already in place. LONG


IOTA/BTC REAADY FOR TAKE OFF!!IOTA/BTC is looking reaaly juicy at these levels against btc.
Expecting upward surge in the coming weeks/months.


IOTA/BTC - 15/10/2020 - The Great AccumulationAlthough IOTA does not have miners or stakers to raise the price, the project has excellent developers and community. In addition, the project counts a lot of enthusiasm in the academic, industrial and technological environment. The Coordicide event should push prices to higher levels in 2021. Until then it is time to accumulate. The weekly chart suggests that below 2600 satoshis is a big accumulation point and the kumo cloud has been narrowing, this means the downtrend could be over soon. A possible Elliott wave 1 and 2 are in the chart.


IOTA - BUY THE DIP NOWIOTA has finally come down to my zone of interest which i've been waiting a couple of weeks for price to retest support. The reaction looks great and its confluence with the 0.618 FIB.
Set up is on the chart...... You can enter 50% of your position now and set bids for the lower 2 although we may not get there if buyers become agressive
Hope your like :-)

Setup is great, but... IOTA-BTC is back to it's "value area" as indicated by light blue. It is what I refer to as "bullish cloud".
There is a bull div on the VZO indicator as well, which tells us that bullish move is around the corner.
First target is very obvious, a 70-80% price boost. I believe this will happen before Christmas.
As for the second offered target, which is anywhere between +150% and 200% from here - I have doubts. I doubt that IOTA can draw sufficient amount of retail traders which are needed to execute a pump of this scale in the current market conditions which are full of doubt and fear. But then again IOTA whales likely need an exit pump so this is what may just happen.

IOTA/BTC (Test Major Support?)💎Technical Analysis Summary💎
BINANCE: IOTABTC
-IOTA is trading on a downtrend channel
-It is approaching the key support area at the 2100s sat
-If we see a reversal or channel breakout
-That's a good entry point with proper stop loss location
-The upside potential is up to 2900s sat or higher
``````````````````````````````````````````````
Trading Involves High Risk
Not Financial Advice
Please Exercise Risk Management
``````````````````````````````````````````````
If You Like My Daily Published Ideas
A little Help By Supporting My Channel
Through Leaving A Thumbs Up, Comment & Follow
Happy Trading! --> Thank You! :)
``````````````````````````````````````````````

Iota Trading IdeaHello Traders,
IOTA is close to a very important historical level. A level where the price did important reversions movements recently. Historical levels like this usually are ideal zone to open one position to buy or to sell. If it does a reversion signal at this level. For instance, a double button or a head and shoulders at this level.
For more analysis like this please push the like button and follow us on the Tradingview.

IOTA/BTCContrairement à beaucoup de projets sans technologies bien particulières, ou encore d'autres pseudo mine d'or, le projet IoT (internet of things) reste solide et vit très bien dans son temps, voitures connectées, radars, transmetteurs/récepteurs, etc..
Tout comme le BTC, l'offre de la crypto MIOTA, est bien definie
2,100,000,000,000,000 Satochi pour le BTC
2,779,530,283,277,761 Iota pour le MIOTA


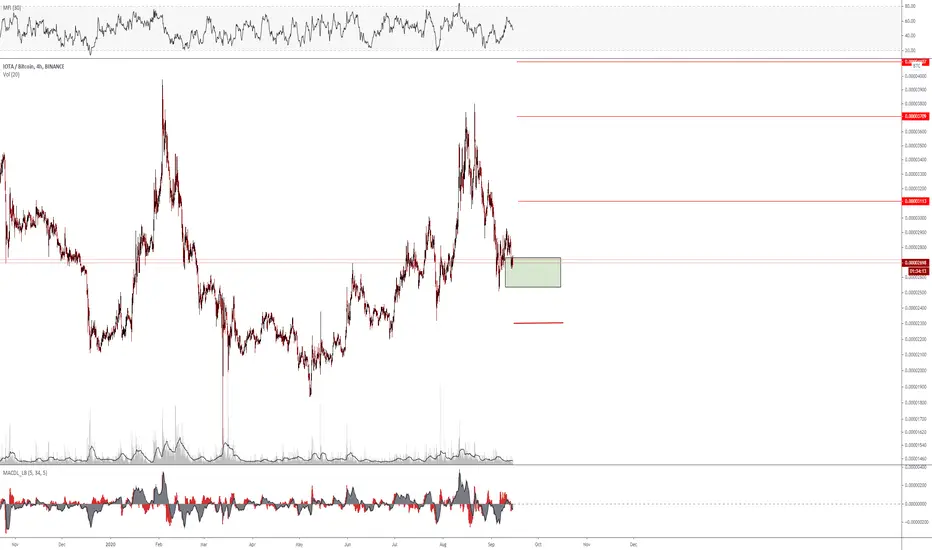
IOTA vs BTC ---LONG---14.09.20
#IOTABTC
Type: LONG
Buy at: 0.000025 - 0.000027
Size: 3%
arget:
1) 0.000031
2) 0.000037
3) 0.000041
SL: below 0.000023