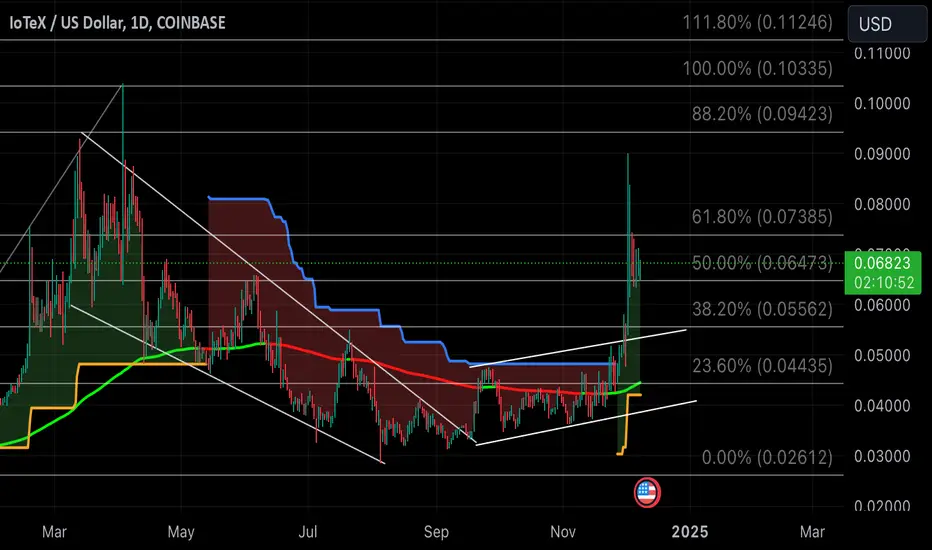
IOTX-Update: Great Buy zone = Don't ghost this opportunity Bounced off a low not seen since October 2024...a great opportunity!
Just look at the 3 Take Profit Zones plotted.
Easy money. Hold until profitable...my estimate within the next 30 days.
IOTXUSD trade ideas

IOTX Consolidation Between Support and Resistance
To analyze the shared chart, I need to evaluate the drawings and key levels you have highlighted in the image. The horizontal area you marked appears to be a support or demand zone.
Support Zone (Shaded Area): It can be observed that the price has tested this level several times and reacted from it. This indicates that it might be a strong support level.
Horizontal Line: It seems to point to previous high levels. This could be considered a potential resistance level. If the price gains strength from the support zone, it is likely to target this level.
Price Movements: Consolidation (sideways movement) is observed in the support zone. This could indicate an accumulation phase or preparation for a strong breakout, either upward or downward.
Potential Scenarios:
If the price reacts upward from the support zone, a move toward the resistance level can be expected.
If the support zone is broken downward, the price may seek new lower levels.

$IOTX Update-Still Bullish to 2nd retest of $0.10Doing great and now macro bullish supertrend confirmation. We should see another strong retest of $0.10 soon. Still time to get in if you haven't already.
IoTeXOne of the great projects in the crypto market which show promising future. The technical analysis is straightforward; well, almost. After the previous impulse wave ended, price entered a corrective wave and now it seems finished around 0.5 Fibonacci retracement. Also, there is a consolidation zone shaped like a box or more likely a triangle in which the price has been oscillating for a while. Let see what happens after price break this consolidation zone upward.

IOTEX and JASMY_chartsLooks like there is a strong similarity between IOTX and JASMY. Both were listed to coinbase around the same time,.

$IOTX-Update over 18% from last postUp 18% from last post...still hasn't blasted off, strap in it's happening soon!

IOTX looking primed up for a bullish runComing out of its descending channel after bouncing off near 0.0% Fib Retracement. Average resistance at nearly/exactly each Fib Level moving back up to at least 100% correction...nothing too scary. As you can see from this 12 month cycle, it's in a Discount Zone to accumulate.
Low Risk Entry: As price rises set Take Profit limit order at each Fib Level minus 1%-2% to help ensure order executions.
High Risk Entry: After entry sit and hold until 100% correction back to $0.0923

IOTXUSD 1W looking like H&S in play....bearish momentumAs above.
Looks like H&S formation on 1W and 1D charts. MACD on 1W is below the signal line and looking close to crossing baseline, which is bearish type momentum.
Overall, short term outlook looks bearish and may have potential for price action to tend towards previous bottom below 0.02 to 0.013 and nearly 100% retracement from local ATH in April of 2024.
Will follow.
Good luck traders.

(IOTX) iotex In only a matter of five to six minutes this huge 15% candle was depleted on IOTX. How is that possible? How would other parties know as soon as it happened to sell on that candle? Was it internally? Was it an outside force? I'm baffled by how fast this candle was reduced. Why not add to the value rather than reduce?
This is purely greed for the sake of greed and I don't like the look of it.

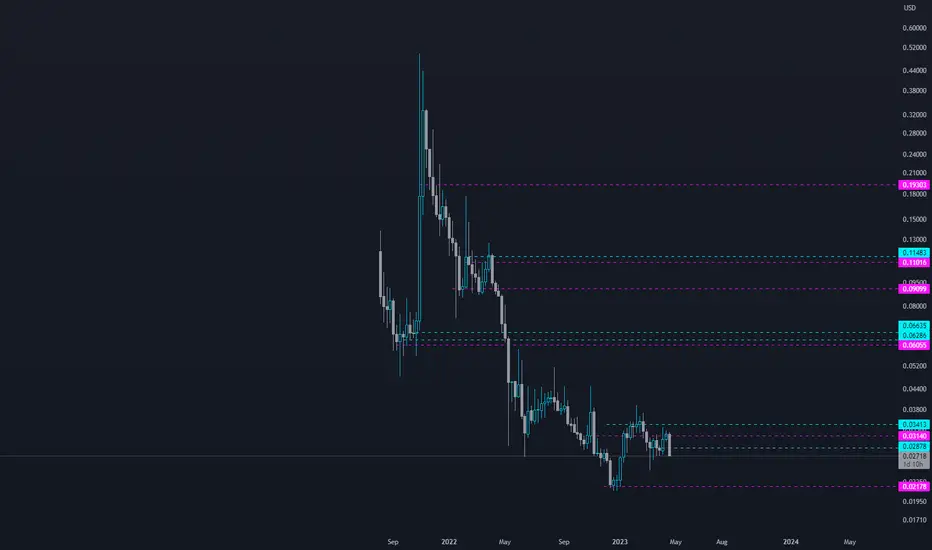
IOTX Correction Analysis
We can get a good overview of the correction in the weekly chart.
The ABC correction is beginning to find support levels, but it hasn't tested the major gray zone at 0.040. Of course it doesn't have to, but this would be a good level to look for long trades.
Once the purple level (at 0.0667) breaks, I'm definitely bullish.

(IOTX) iotex; blockchain - layer 1 IoTeX blockchain imagined Elliott Wave pattern; end of run? Time for a continuation? I tend to lean on the side of Elliott Waves need to be much larger in timeframe than people tend to--. I think this could be right but then again I don't have the money to move markets like some people, groups, and infrastructure do, so this is still speculation.

Iotex ( Internet Of Things )IOTX, It already has the attention of the government and big tech compaies, this coin can do numbers given the use case. I will long Hodl & stake this coin.

$IOTX impulse waveElliot wave pattern depicting potential impulse wave taking us to $0.185.
Depin is quickly gaining traction and is garnering attention from major players in the industry. In the long term (2 years time) I see IOTX hitting the $2 mark.

#IOTX 5 year price targets Target 1 = $1
Target 2 = $3
Target 3 = $5
The DePin revolution is here. Are you ready for the ride?

1W IOTXUSD: Looking interestingAs above...
1W chart showing bullish MACD divergence and recent breakout of descending wedge. Price action is currently testing July 2023 local highs near 0.0248.
Currently oversold on daily RSI, but if uptrend continues then 0.028 a possible next target. Would like to see volume pick up though.
I think overall looking bullish going into the end of 2023 and into 2024 and will be even more so if it breaks above 0.029.
Will follow.
Good luck traders!

IOTX remains bullishI made this call along with others back in November, SEED_DONKEYDAN_MARKET_CAP:IOTX RSI looks great, and its steady climb confirms for me it's ready to go!
So excited for the future of legitimate altcoins, which also includes pair of Meme coins.
Let's see how the rest plays out, .24c near future?
Check out my other ideas as well.

Iotx Looks good for a bottom. Up 50% in 24hour looking for some decent scalps
Expecting some resistance around $0.06
Could see a push to up to $0.12 before some stronger resistance.
Good luck and have fun with it.

IoTeX longIoTeX bounced off the ascending trendline and bounced off the support level. Bullish movement to resistance level at 0.0262 is expected to happen.

IoTeX longIoTeX broke trough the resistance level. Asset broke trough the descending trendline. Bullish movement to resistance level at 0.0267 is possible.

IOTX AwakeningIOTX is awakening after a period of prolonged accumulation. If bullish sentiment remains, we can anticipate a healthy markup. It seems bent on doing its own thing, regardless of where BTC is going. Nevertheless always keep an close eye over your swing assets and be prepared to bail if IOTX's PA falls through the regression trend.
*Be sure to subscribe for more accurate & easy-to-follow swing charts with win ratios averaging between 80-85% in smashing the profit zones. I've been swing trading crypto since 2017 and handpick all the runners myself after conducting a series of careful volume-to-spread reads and Wyckoff schematic comparisons. Check out my past charts and see the win rates for yourself, then follow me on TradingView and cash out with me!
**Not financial advice. Always DYOR and trade at your own risk.

IOTXUSD Bull ExperimentHigh risk to reward ratio. Liquidity is very low, but this could be a strong small cap runner if the market turns around.
