IOTXUSDT trade ideas

IOTXUSDT Iotxusdt on best support
And can take profit about 6%
4hours time
Buy,stoplost and TARGET can see you
ACHAKZAI ANALYSIS


#IOTX $IOTX This is our Technical Analysis on #IOTX 1h!
In 1h TF IOTX is on bullish Market
Give attention to strong levels when price reach there!

IOTXUSDT BATBat
The Bat Pattern is a 5-point retracement structure that was discovered by Scott Carney in 2001. It has specific Fibonacci measurements for each point within its structure and it is important to note that D is not a point, but rather a zone in which price is likely to reverse, called the Potential Reversal Zone (PRZ). The B point retracement of the primary XA leg must be less than a 0.618, preferably a 0.50 or 0.382 and the PRZ consists of 3 converging harmonic levels: 1) 0.886 retracement of the primary XA leg, 2) extended AB=CD pattern, usually 1.27 AB=CD and 3) minimum BC projection is 1.618.
The first target would be the 382 retracement of AD and the second target the 618 retracement of AD. A common stop level would be behind the X-point. Conservative traders may look for additional confirmation. Bat Patterns can be bearish and bullish. TradingView has a smart XABCD Pattern drawing tool that allows users to visually identify 5-point reversal structures on a chart.

IOTXUSDT BATThe Bat Pattern is a 5-point retracement structure that was discovered by Scott Carney in 2001. It has specific Fibonacci measurements for each point within its structure and it is important to note that D is not a point, but rather a zone in which price is likely to reverse, called the Potential Reversal Zone (PRZ). The B point retracement of the primary XA leg must be less than a 0.618, preferably a 0.50 or 0.382 and the PRZ consists of 3 converging harmonic levels: 1) 0.886 retracement of the primary XA leg, 2) extended AB=CD pattern, usually 1.27 AB=CD and 3) minimum BC projection is 1.618.
The first target would be the 382 retracement of AD and the second target the 618 retracement of AD. A common stop level would be behind the X-point. Conservative traders may look for additional confirmation. Bat Patterns can be bearish and bullish. TradingView has a smart XABCD Pattern drawing tool that allows users to visually identify 5-point reversal structures on a chart.

#IOTX/USDT(SWING TRADE)
There a falling wedge in daily chart pattern that's signal for upward move in swing trade buy and hold it and waiting for hitting target
MACD is neutral
EMAs showing a bullish move
RSI is neutral
targets set at the chart
GOOD LUCK

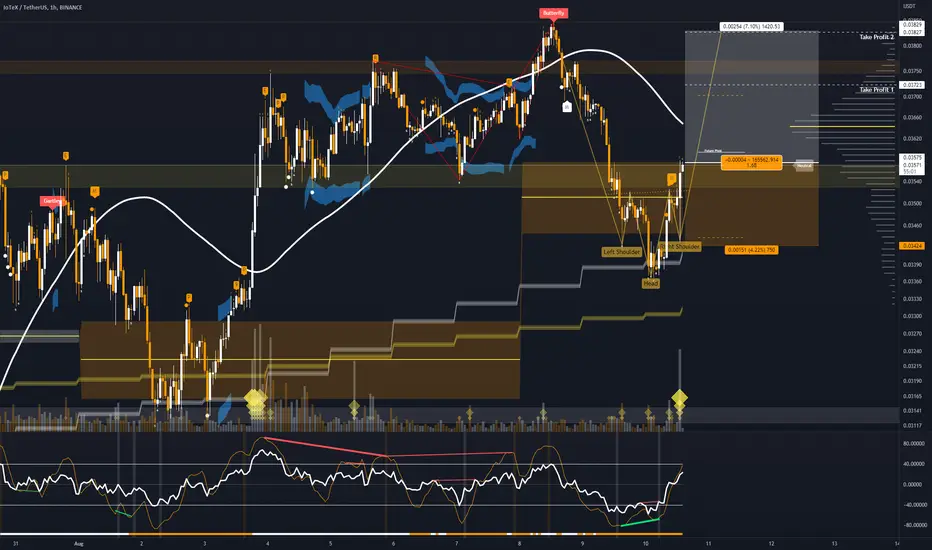
🎲 #IOTXUSDT #LONG #SCALP #IDEA 🎲🎲 #IOTXUSDT #LONG #SCALP #IDEA 🎲
Risk
- Medium
Entry Conditions:
- Inverse Head And Shoulders Pattern
- Volume spike coming in
- Positive CPI Data
News Source:
- Positive CPI Data
Entry: $0.03575
Take Profit 1: $0.03723
Take Profit 2: $0.03827
Stop-Loss: $0.03424
IOTUSDT |Coin Review| Rebound from local resistance!hello trader Today I prepared a new idea for you. Like and subscribe to the channel there is a lot of useful information✅
Friends, IOT showed a good growth of almost 15%, as some alts showed a good percentage too.
I think that after all, we will push up the channel borders and see a correction approximately in the $0.034 zone
Then you already need to watch how the market will behave, this is an approximate take profit, you don’t need to climb immediately with a large leverage and wait for these values, I gave you a chart, now think with your head and wake up in profit)

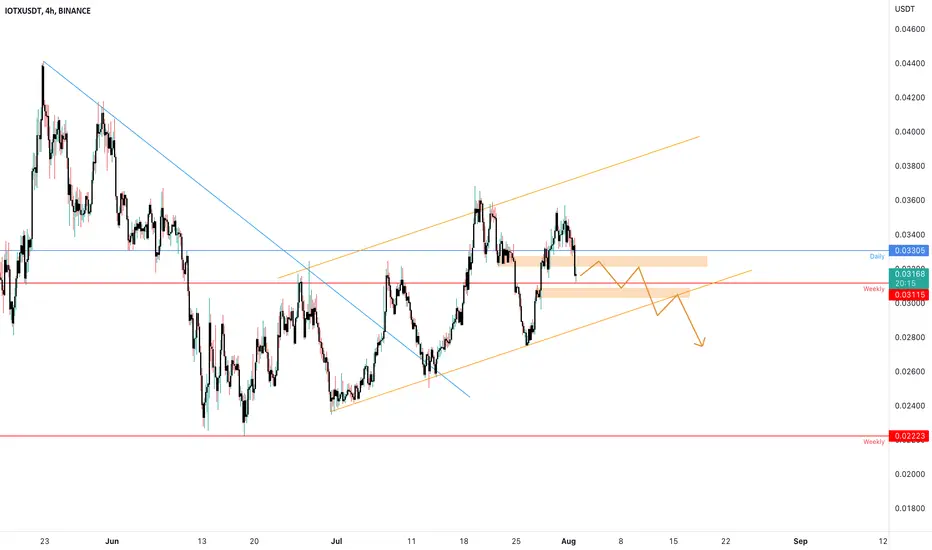
IOTXUSDT is testing the supportThe price is creating an ascending channel above the weekly support at 0.31$, the price got a rejection from the ascending resistance and now it's testing a key level.
How to approach it?
IF the price is going to lose the current 4h support, According to Plancton's strategy , we can set a nice order
–––––
Keep in mind.
🟣 Purple structure -> Monthly structure.
🔴 Red structure -> Weekly structure.
🔵 Blue structure -> Daily structure.
🟡 Yellow structure -> 4h structure.
–––––
Follow the Shrimp 🦐
good position to get long...It really nice position to take it
lo risk and high profit,,, as always I do.....
Don’t forget SL

IotxWe are moving higher from here. It's just gathering some momentum. A reverse pull back am expecting. After which we bullish

IOTX could be in a downtrend - Cryptoz18❶ Warning
Operations in the Blockchain or FX market represent a high risk. Cryptoz18 is a content creator who posts his ideas for viewers however he never provides an investment recommendation. I recommend to the reader a good risk management and knowledge regarding the environment. Thank you very much.
❷ Tutorials
➤ Here you can find a brief explanation of how the operations work in case you are interested in following them.
➤ Here you can find an explanation of how to track our ideas:
✔️ Our operations are taken with StopLoss and Take Profit of 15 minutes. However, we are looking to try and catch a 4H trend. So, once we touch the TPM according to your own analysis you should consider whether to close the trade or move StopLoss to entry.
❸ Operational Information
• Entry price: 0.03306
• StopLoss: 0.03496 (Loss 4.89%)
• TakeProfit Minimum: 0.03175 (Win 4.80%)
• Recommended margin: 5% of the Futures account
• Recommended leverage: 1x.
• Temporality: 15Min - 4H

$IOTXPull back to the 200 , taking a punt at this
daily stoch about to cross so going to give this a day maybe 2
still thinking flush before weekly close then we continue up so trade with caution
dominance is also looking like it may start its journey up so maybe time to long corn as opposed to alts

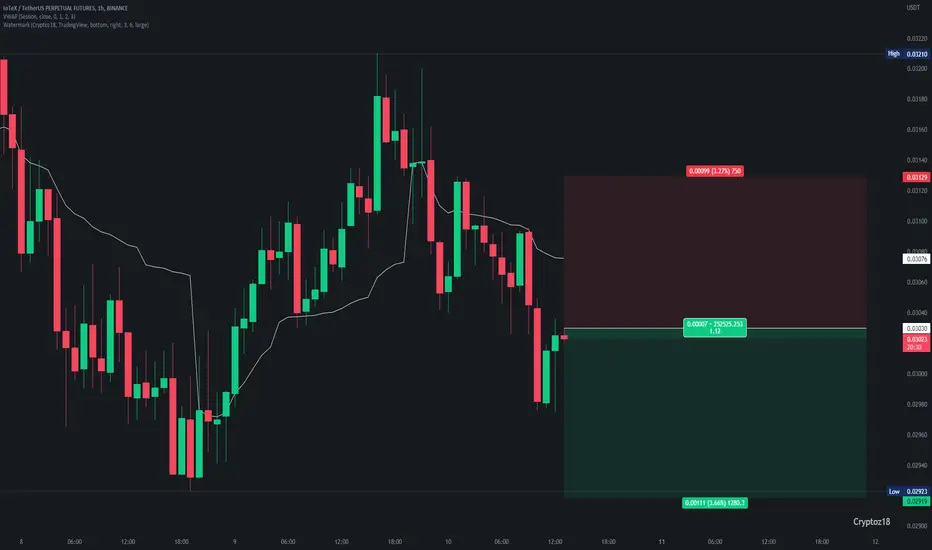
IOTX Possible Downtrend on H4 - Cryptoz18█ Operation Information
IOTX after a very strong uptrend is currently at stake in its 4H trend, I personally expect a breakout to the downside.
█ Operation data
• Entry price: 0.03076
• StopLoss: 0.03129 (Loss 3.27%)
• TakeProfit Minimum: 0.02919 (Win 3.66%)
• Recommended margin: 5% of the Futures account
• Recommended leverage: 1x.
• Temporality: 15Min - 4H
✔️ Data: The user is recommended to move the StopLoss to entry once we reach the TPM or also known as the Minimum TakeProfit.
In this way, if the trend is good for a longer timeframe, it will never touch the StopLoss placed on our entry. We will only have to pay the commissions in case we get the SL at the entrance.
Being a 15-minute trade looking to take a 4H trend it is likely to have a fairly low Winrate due to the tight StopLoss however this offers us better risk management. We try to take a 4H trend using SL and TPM of 15 minutes.
This way, we seek to obtain a profit of 100% between all operations. Only 5% of the account per operation could achieve our objective and thus obtain a return of 5-7% per month of the total account. This will be reflected at the top of our profile.
]█ Explanation of how the operations work:
Here you can find a brief explanation of how the operations work in case you are interested in following them.
█ Warning
✔️ Blockchain or FX operations represent a high risk. Therefore, this operation should not be taken as an investment recommendation. All I do is share my trade ideas publicly for the viewer to do their own analysis and decide to enter based on her own decision making. The viewer is recommended to have good risk management in their operations. To do this, take into account the fundamental data of Asset Volume, Market Capitalization, Supply, Percentage Change Price, Current Volatility, Perpetual Data, and lastly, proper Margin and Leverage management. Be careful, you can lose all your money in the future if they have poor risk management. Nothing more to say thank you very much.
IoTeX Longterm TF Analysis (Bottomed Out=145% Bullish Potential)Good evening my fellow crypto-trader, I hope you are having a wonderful day.
Let's look at IoTeX (IOTXUSDT) on the weekly timeframe together...
We start with the major downtrend marked on the chart.
This downtrend has been broken.
Notice the long lower wick candle on the week of 9-May.
This wick sets the low.
We have a -9 on the TD Sequential after the low candle and then a higher low, signaling that the bottom is being formed.
After almost 2 months of consolidation, a bullish breakout shows up...
This is our signal.
Based on the above information we can expect additional growth.
145%+ mapped on the chart.
Note: The 9-May low can be used as the stop-loss.
Namaste.

IOTXUSDT needs to create a new breakoutThe price bounced from the demand zone on 0.022$ on 4h Timeframe and retested the 0.786 Fibonacci level.
The price is testing the previous support as new resistance above the demand zone.
How to approach?
IF the price is going to grab new liquidity and create new breakout from the 4h resistance, According to Plancton's strategy , we can set a nice order
–––––
Keep in mind.
🟣 Purple structure -> Monthly structure.
🔴 Red structure -> Weekly structure.
🔵 Blue structure -> Daily structure.
🟡 Yellow structure -> 4h structure.
–––––
Follow the Shrimp 🦐

IOTX Breakout Here !!!IOTX/USDT 10x " Long " Signal
Now : 0.0277$
Target : 0.03$ - 0.032$ - 0.035$
Enjoy !!

IoTeX shortIoTeX bounced off the descending trendline. Asset bounced off the resistance area. Bearish movement to support level at 0.024 is possible.


Buying #IOTX Here !!We trade IOTX many many times and never failed . This time too , my target is 0.03$ for the short term . We know what we have to do . It's not foreign to us

#IOTEX $IOTX testing resistance, more upside coming?iotx has been testing the 4h resistance level around $ 0.0255
if we see a good breakout from the one, with good volume , and a good retest, we can set a long order with $ 0.029 as the target (following 4h resistance) and something around $ 0.023 as the stop loss, which is just below the swing low, which could act as new support and bring the price back up on a retest
let me know what you think about this idea and if you are planning to enter on this trade + like and follow for more ideas

GemHello dear investors
Given Iotex's uptrend and clean chart, the area between 0.015 and 0.022 is a great entry point.
The overall structure of the chart has a very strong upward trend.
