A visit back to low $0.12 ?Selling pressure seemed strong enough for a pullback to range of $0.12, still very stong and compared the previous move it had with less volume, so still upward momentum could happen if more volume comes in, but before that we need to retest range of $0.12 for support.
👁️🗨️ This is just my opinion, Price doesn't HAVE to agree with it, ALWAYS DO YOUR OWN RESEARCH.
💣 Use stop-loss and be safe.
💥 Follow and like for more updates on IOTX/USDT.
💦 Risk what you can lose.
IOTXUSDT trade ideas

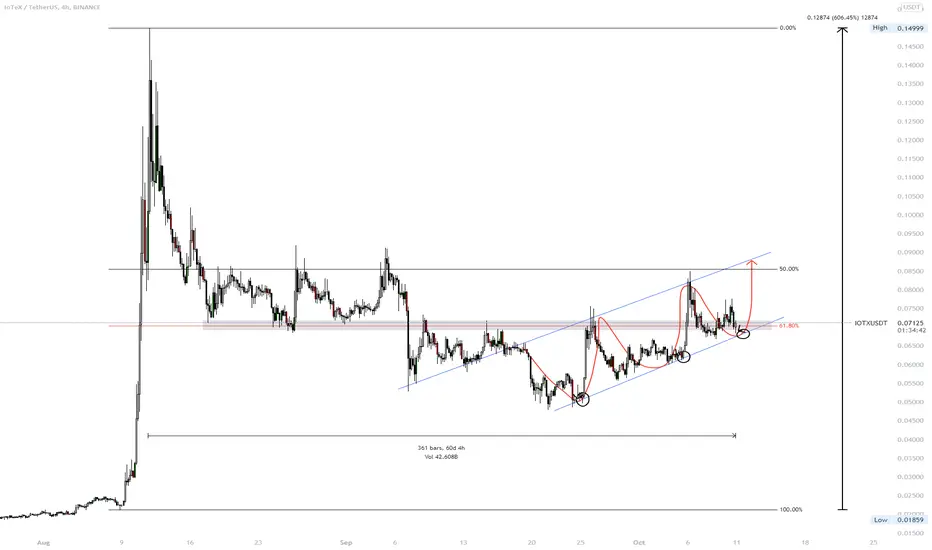
IoTeXAscending channel with price finally finding support above the 61% pull back on the +600% run up. Progressive higher lows suggest IOTX may have the strength to either create the next leg up or simply slowly rise like most of the market will given BTC continues to ascend.
IOTXIOTX broke out the high of 14cents, short shot to 18cents before a correction phase.
currently consolidating in a range, wait for shakeouts, ST"s and springs before you make a play.


Will the uptrend continue?I think it will. Just got put on travala.com for travel payments. The pebble tracker is about to shock the blockchain world. I don't know of another team making real world products. As more devices come online on the future coins get burned. Think about that. DYOR! Tried to tell ya in my last post . Up 100%+ since.

IOTEX/USDT - Long ripper!!Looking at history repeating itself.
Details pulled from coinmarket.com
What Is IoTeX (IOTX)?
Starting as an open-source project in 2017, IoTeX has built a decentralized platform whose aim is to empower the open economics for machines — an open ecosystem where people and machines can interact with guaranteed trust, free will, and under properly designed economic incentives.
With a global team of over 40 research scientists and engineers, IoTeX has built their EVM-compatible blockchain from scratch using the innovative Roll-DPoS consensus and launched in 2019 April, which has been running by 100+ delegates worldwide and has processed more than 10 million transactions already. On top of the IoTeX blockchain, the team has built the essential blocks of infrastructures to connect with Ethereum, BSC, and Heco blockchains such as ioPay wallet (iopay-wallet.iotex.io) and ioTube bridge (tube.iotex.io), which serve ten thousands of users. IoTeX helps EVM-based DApps scale without concerning expensive gas fees!
Besides, middleware such as Decentralized Identity, Confidential Computing, and Secure Hardware has been built on top of IoTeX blockchain to enable self-sovereign devices such as Ucam real-world oracle such as Pebble. The former (ucam.iotex.io) has been deployed to 3000+ households (iott.network) and still proliferates. In contrast, the latter has been launched to 300+ developers initially and enables innovative Dapps that connect the physical world with the crypto world, such as real-world NFTs, weather derivatives, and machine learning-as-mining.
Max Supply
10,000,000,000
Total Supply
9,626,124,332
Market Cap $642,132,322.14

One trade. Quota. ATH Play.Thank you. Thank you.
Quota for today.
near ath
d- kicker
h1 - CH
m15 - ema trail

IOTXUSDT Daily Timeframeanother flagpole movement?
just be careful on the historically functioned UTL as R.
but still some room for ultimate grow

Hourly RSI above 90, short consolidationSo I mentioned this just hours before the run, fun day :))
On the hourly charts RSI is heated up too much, a short term consolidation is likely, take profit and come back in a couple of hours as comparing the volume to previous runs of this coin shows there is still room for growth. $0.2 is the first target short term.
Good Luck!

Perfect Position for IOTXFundamentally this project is perfect, they are literally the better $MIOTA, can't say much more about it. Comparing $MIOTA and $IOTX MC shows the potential.
I can see it easily get bigger than $MIOTA, many partnership with big real world companies etc.
On chart we see consolidation periods for the past 2-3 months, which (looking at IOTX history) could be signaling a turn around.
Ready for a BOOM!
Good Luck!


IOTX LOOKS PRETTY BULLISHIOTX gonna pump asap, take profits are provided in the chart, place your order im the green box and save your profit in each red box and enjoy

IOTX: Nice things happeningAn inverse head and shoulders seems to be forming. RSI is currently on healthy levels and i’m looking for a breakout of that too.
I usually don’t trust these types of patterns but if it breaks the neckline i’ll be looking for a small scalp.
Good luck!


IOTX Long - Terms investBuy #IOTX by market
Current price (Buy price): 0.067$
◾️ I set my goals for sale using a ladder (taking into account the leverage x10):
Target 1 : 0.069$ (+30%)
Target 2 : 0.0778$ (+60%)
Target 3 : 0.078$ ( +80% )
Target 4 : 0.08$ ( +100% )

IoTeXHi everyone,
This is my description:
Purple Lines: Support & Resistance (for a week) “VERY IMPORTANT”
Blue Lines: Support & Resistance (for a day) “IMPORTANT”
Orange Lines: Support & Resistance (for a 4H)
Thanks for your attention.

IOTXUSDT - BULLISH SIGNAL UPDATEAs you all know, IOTX is not performing well from last 2 week and according to the Chart patterns, Ascending Channel is formed and also indicators giving bullish signal. + It has HardFork Event ( Bullish Sign).
Short term Trade, DYOR Before taking trade, as i'm not responsible for your loss.
RISK FACTORS:
Market/ BTC CRASH
Happy Trading :)
Good Luck!
If you like my idea, please support:
Binance Smart Chain ( BSC ): 0x69Ea86D0f6B762fC36A322b0C833D2bd04534b3d

Iotex team seems to be making movesThis project is so solid. With the pebble tracker going into action, possibly being introduced into medical field for tracking medical supplies. Could even be used in the automobile industry for insurance purposes, and I think it will be used for that as well. Breaking a long term patter recently and looks poised to break another bull flag. Look into this project, it's gonna do big things.

IOTXUSDT BAT SETUPBy using Bat Harmonic pattern the target is around 0.886% Fibo retracement of X-A.
Confirmation entry when price break above B level and breakout from triangle.
Pattern invalid if fall below C level.
#TAYOR HUOBI:IOTXUSDT

IOTX Accumulation cylinder Charts say it all boys. It's go time. Volume through the roof. Time to fucking send it! REEEEE!

Buy IOTX Breakout Buy #IOTX by market
Current price (Buy price): 0.0705$
◾️ I set my goals for sale using a ladder (taking into account the leverage x10):
Target 1 : 0.0728$ (+33%)
Target 2 : 0.074$ (+60%)
Target 3 : 0.0076$ ( +80% )
Target 4 : 0.0775$ ( +100% )

