IOTX 125% PROFIT POTENTIALiotx moving as expected 30% profit just in 1 day
analysis was shared yesterday today running in 30% profit
this is you can earn by learning with patience and consistancy
IOTXUSDT trade ideas

IOTX/USDT Custom Fib RetracementHello Tradders !
I am Using IOTX/USDT Binance 4h Chart pattern
This is my Custom Fib Retracemnt Setting and its tested so many times and it works perfect
So here i am sharing with you the price will drop 0.27 fib levels and will come back after touching 0.618 fib Lavels
and Laghari Rsi is also my custom made now lets see the results and cheers.

IOTX 125% PROFIT POTENTIALtesting trendline in daily tf
incase of breakout expecting 125 to 130% profit keep eyes on that

IOTXUSDT| BULLISH TRENDIOTXUSDT has been trading under the falling resistance.
Recently it has broken above the falling resistance.
The bulls keep hold an important support.
The bulls are in control.
Manage your levels accordingly

IOTX - Buying SignalBYBIT:IOTXUSDT.P
4H time frame
-
IOTX already broke the triangle and rerested the upper downtrend.
It also met Dow Theory of entry, so we can long it here.
-
Entry: Market
Add: 0.2725
TP: 0.0305, 0.0355
SL: 0.0267


IOTXUSDT is testing the 4h supportThe price is inside a descending channel on the daily timeframe and now the market is testing the 0.618 Fibonacci level on the 4h timeframe
How to approach it?
IF the price is going to lose the current support, According to Plancton's strategy , we can set a nice order
–––––
Keep in mind.
🟣 Purple structure -> Monthly structure.
🔴 Red structure -> Weekly structure.
🔵 Blue structure -> Daily structure.
🟡 Yellow structure -> 4h structure.
⚫️ black structure -> <= 1h structure.
–––––
Follow the Shrimp 🦐

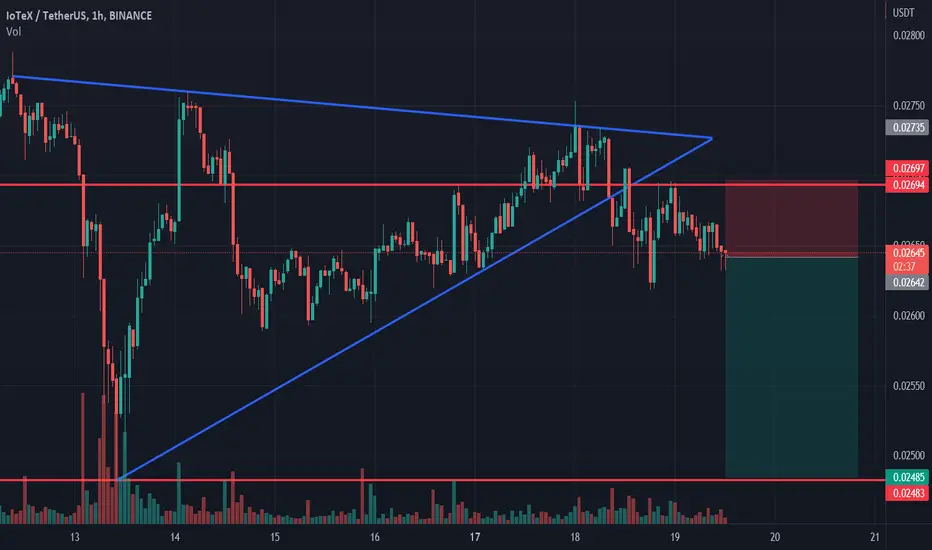
IOTX longIOTX bounced off the lower boundary of descending channel. Bullish movement to resistance level at 0.02704 is possible.

IOTX shortIOTX broke trough the support level. Asset broke trough the ascending trendline. Bearish movement to support level at 0.2485 is possible.
IOTX/USDT wait for entryHey guys))
IOTX/USDT is another coin for our watchlist! Well hard to tell what will happen to this coin in short-term but we want to see the push from IOTX. so we are going to set some limit orders which will be above EMA100 and EMA200.
If you like ideas provided by our team you can show us your support by liking and commenting.
Yours Sincerely,
Swallow Team 🔱
Disclamer:
We are not financial advisors. The content that we share on this website are for educational purposes and are our own personal opinions.

IOTXUSDT wants the breakout!The price is inside a descending channel on the daily timeframe and now it's trying to have a breakout from it
On the daily timeframe the price printed a new Lower High
How to approach it?
IF the price is going to have a breakout and retest it as new support, According to Plancton's strategy , we can set a nice order
–––––
Keep in mind.
🟣 Purple structure -> Monthly structure.
🔴 Red structure -> Weekly structure.
🔵 Blue structure -> Daily structure.
🟡 Yellow structure -> 4h structure.
⚫️ black structure -> <= 1h structure.
–––––
Follow the Shrimp 🦐

IOTX shortIOTX bounced off the descending trendline. Asset broke trough the support level. Bearish movement to support level at 0.02585 is possible.

IOTXUSDTFound some support @ the 0.61 Fib. level
Broke the ascending trendline support on the DTF and is now re-testing it with the S&R zone on the 4H TF
*DTF PP S1 ~ 0.02658 + 0.78 Fib. level + demand zone
*4H TF ~ 0.02844 + 0.71 Fib. level + demand zone

IOTX/USDT sitting at important level! Morning/evening/afternoon
IOTX/USDT pair has come to our watchlist again and now we see that it will be good opportunity for a breakout from this bearish trend. Setup looks really great thanks to EMA200 and we hope to see a clear breakout BUT if this zone fails then we might for for lower side of that down-trend.
If you like ideas provided by our team you can show us your support by liking and commenting.
Yours Sincerely,
Swallow Team 🔱
Disclamer:
We are not financial advisors. The content that we share on this website are for educational purposes and are our own personal opinions.

IOTXUSDT - Long by Supertrend, ADX & MA 9/24/20221. ADX INDICATOR: 1h & 4h timeframe have a strong strength for open trade.
- ADX smoothing: 14.
- DI length: 14.
- ADX STRONG > 25.
2. SUPERTREND INDICATOR:
- Long trend when closes candle is above the green line.
3. MOVING AVERAGE INDICATOR:50
- Long trend when closes candle is above the green line.
- BUY/LONG: reject to Supertrend at current timeframe.

IOTX Long from Here, Never a Fin ADIts a future coin, its a privacy coin.
many exchanges are delisting privacy coins.
Never over lev as it is sep.... Play safe, use low lev
gain n close the positions.

IOTX is Ready For LONG PositionIOTX /USDT is Going to get a good setup for LONG POSITION
you can get this position with LEV10 X
Good Luck & dont forget to set SL & TP


IOTXUSDT wants the 0.618 Fib?The price is creating a descending channel below the 0.382 Fibonacci level at 0.034$ area.
The price bounced exactly on the lower trendline of the ascending channel and now the market is testing a confluence zone.
How to approach it?
IF the price is going to have a breakout from the descending channel and 4h resistance and retest the resistance as new support, According to Plancton's strategy , we can set a nice order
–––––
Keep in mind.
🟣 Purple structure -> Monthly structure.
🔴 Red structure -> Weekly structure.
🔵 Blue structure -> Daily structure.
🟡 Yellow structure -> 4h structure.
–––––
Follow the Shrimp 🦐

Sell IOTXUSDTHi There,
Since we have:
1- 1W on downtrend wave pattern
2- 4H on downtrend wave pattern
3- Pull back on MA and Fibo level 38% and Support and RN (round number) of 0,0350
We expect a downtrend to:
TP1: 0,0295
TP2: 0,0234
Good luck
@TradeItDB


IOTX/USDT had some great news!Hey guys,
Another coin that we will talk about it IOTX. This coin had great news about getting listed to Gemini platform so with this news and great pattern we will buy some to hold. Not much to say about this position that we take, as always Red-zone is buy zone and Green-zone is open for any target))
What is your opinion on this coin?
If you like ideas provided by our team you can show us your support by liking and commenting.
Yours Sincerely,
Swallow Team 🔱
Disclamer:
We are not financial advisors. The content that we share on this website are for educational purposes and are our own personal opinions.

IOTXUSDT Ascending Channel !IOTXUSDT Technical analysis update
Short level: $0.0292 - $0.0298
Stop loss : $0.0320
TP 1 : $0.0275
TP 2 : $0.0251
TP 3: $0.0223
Always keep stop
Thanks
Hexa
