IO AI-focused blockchain startup💰IO #LONG
➕Open positions 1.96-1.88
📈 Take profit: 2.15
📈Take-Profit: 2.43
📈Take profit: 2.87
⛔️ 📉 Stop Loss: 1.73
🔥Risk-reward ratio 1/5
🆘 Recommended trading volume: 5% of your deposit amount.❗️
IOUSDT trade ideas

IOUSDTIO ~ 1D
#IO If you have Conviction on this coin, you can make purchases in stages from here. it is only a matter of time until this resistance line is successfully broken.

Initial Base BreakoutIO declined the crypto classic 70-80% from the open and is now tightening up nicely and quiet down in it's initial base. Looking for a breakout and massive catch up trade over the coming weeks.
AI play. VC backed w/ no unlocks until summer 2025

IO.net or $IO Project description:
IO.net is a decentralized infrastructure platform designed to enhance data storage and transfer across multiple blockchains, providing scalable, secure, and high-speed data exchange for decentralized applications (dApps).
Type of project:
Decentralized data storage and transfer protocol.
Is it under a block?:
Yes, IO.net operates as a decentralized protocol across multiple blockchain networks, including Ethereum and Binance Smart Chain, to enable efficient data exchange and storage solutions.
Latest update or news:
As of June 2024, IO.net announced the launch of its Cross-Chain Data Storage Service, allowing dApps to store, manage, and retrieve data across different blockchains securely and efficiently.
Narrative:
Decentralized data storage, cross-chain infrastructure, and scalable data transfer.
Why is it a good investment?
Institutional Backers and Angel Investors:
Polychain Capital:
Polychain Capital is a key backer of IO.net, recognizing its potential to solve critical data scalability and transfer issues across blockchains and decentralized applications.
Framework Ventures:
Framework Ventures, a well-known investment firm in the blockchain space, has also supported IO.net due to its scalable data solutions and integration with cross-chain protocols.
Binance Labs:
Binance Labs has invested in IO.net to enhance cross-chain data transfer capabilities on Binance Smart Chain, which will be integrated with IO.net’s infrastructure for better data storage and efficiency.
Angel Investors:
Balaji Srinivasan (Former CTO of Coinbase):
Srinivasan, an advocate for decentralized infrastructure, has shown interest in projects like IO.net that aim to decentralize and scale data storage across blockchain networks, although no confirmed direct investment.
Kyle Samani (Co-founder of Multicoin Capital):
Samani has expressed support for scalable decentralized infrastructure projects like IO.net, which aim to solve complex issues in cross-chain data and storage management.
Futuristic Use Case:
Cross-chain data storage and transfer:
IO.net allows decentralized applications to store and manage data across multiple blockchain networks, enabling seamless data exchange while reducing costs and improving efficiency.
Data storage for decentralized finance (DeFi):
With the expansion of DeFi, the need for secure, decentralized data storage becomes critical. IO.net’s platform can serve as a backbone for managing and securing data across various DeFi protocols.
Integration with enterprise solutions:
IO.net is positioned to offer scalable data storage solutions for enterprises looking to decentralize their operations and use blockchain for data security and transfer, opening up new use cases beyond dApps.
Decentralized data for gaming and NFTs:
As blockchain gaming and NFTs grow, IO.net provides a decentralized infrastructure for managing large datasets, such as game state data and NFT metadata, securely and efficiently.
Why will it make a significant amount of profits?
Unique competitive edge:
IO.net focuses on cross-chain data storage and transfer, providing a more scalable and decentralized solution compared to traditional data storage providers or other blockchain-focused storage solutions. Its unique infrastructure gives it an edge in the growing decentralized data market.
Increased demand for data solutions in DeFi and NFTs:
As decentralized finance and NFTs grow, the demand for secure, scalable data storage will rise. IO.net’s ability to integrate with multiple blockchains positions it to capture a large share of this expanding market.
Revenue from decentralized storage services:
IO.net will generate revenue through its decentralized data storage and transfer services, which will be in high demand from dApps, DeFi protocols, and NFT platforms that require efficient data handling across blockchains.
Scalability and cross-chain demand:
IO.net’s cross-chain infrastructure is scalable, meaning as blockchain ecosystems grow, the demand for its data storage and transfer services will increase, driving long-term value for SEED_ALEXDRAYM_SHORTINTEREST2:IO tokens.
For those who are asking, just follow me on Trading view, I will share you my full analysis and documents on Google docs.

IO Bullish Trend
Here are the trends on the graph for the IO/USDT pair.
With momentum and current market data, it should be in an increasing trend.
After the interest rate cut, money inflow to cryptocurrencies should increase.
Here is the current altcoin season index, which shows 37; after some accumulation, it should go up to around 75, and the altcoin season will start.
Ref: BlockchainCenter Altcoin Season Index
Generally, technical and fundamental analysis shows the green light for IO.


IOUSDTIO ~ 1D
#IO If you have Conviction on this Coin. You can make purchases gradually after successfully breaking through this resistance line.

#IOUSDT Technical Analysis in an 8-hour TimeframeIO has broken above the resistance trendline and is currently retesting it. The 50 EMA is holding the price, perfectly aligning with the resistance trendline.
If the price rebounds from the current market price (CMP), we can expect a rally up to $3.095, representing a 66% gain. However, if the price drops, the lower support between $1.31 and $1.48 will be a good accumulation range for IO.
Key levels:
- Primary Support: 50 EMA at $1.816.
- Entry: A rebound confirmation from $1.816 support.
- Lower Support/Accumulation: $1.31 to $1.48.
- Initial Target: $3.
- Higher Target: $6.
DYOR, NFA.
Like, share, and follow for more.
Thank you.
#IO #Crypto

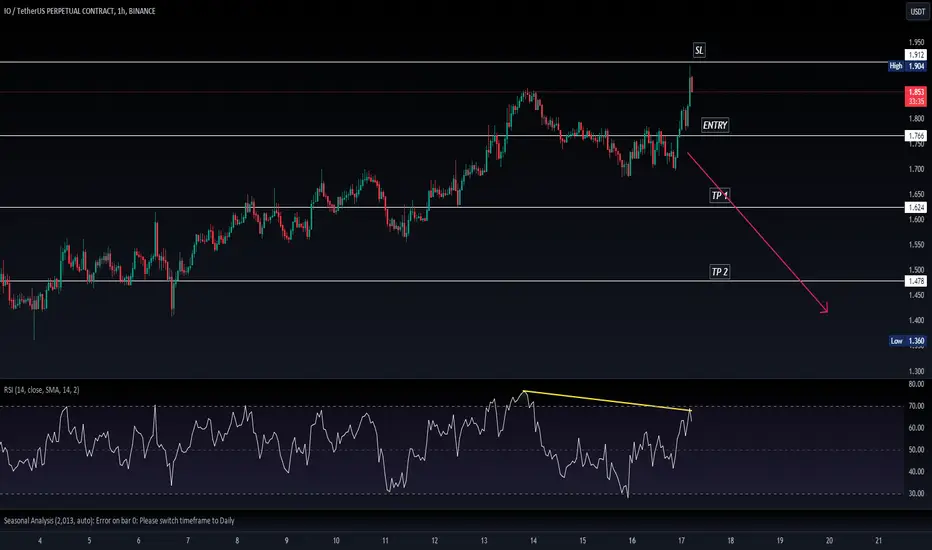
IOUSDT.PIOUSDT.P is in bullish trend.
Bearish divergence also shown in RSI.
we wait for the further confirmation .
If trend will breakdown and break last HL then it will go down.
IO / USDT BINANCE:IOUSDT
In trading, a support level is a price point where a coin or stock tends to stop falling and might start rising again. If Io Coin's price holds at $1.517, this means it's finding stability at that level.
Resistance is where the price struggles to rise above. For Io Coin, $1.884 is currently the resistance level. If the price breaks above this point, it might continue to rise, with the next major resistance level being $2.33.
So, if the price stays above $1.517 and surpasses $1.884, the next target to watch would be $2.33.
Current Support Level: $1.517
Resistance Level: $1.884
Next Resistance Level: $2.33
Disclaimer: The information provided here is for educational and informational purposes only and should not be considered as financial advice. Trading and investing in financial markets involve risks and may not be suitable for everyone. Always conduct your own research, consult with a financial advisor , and consider your own financial situation and risk tolerance before making any investment decisions. The author or provider of this information is not responsible for any financial losses or damages that may occur as a result of using or relying on this information.

ioIn the long term, I think it can be good for the blue lines
In the short term, the red numbers are all resistance that can help us move towards the green line

#IOUSDT 4H LUCK GOOD FOR 2 WEEKOn his way to 2.3$ and more this week ! follow for more idea- super bullish on it!

IOUSDT Surges Towards Target 3 with a 48.57% Profit GainIOUSDT has continued its impressive ascent, successfully hitting its second target and nearing the third. The cryptocurrency's performance has been remarkable, offering a substantial profit of 48.57% to traders. This strong bullish momentum has drawn attention across the market as it steadily climbs through resistance levels. With the third target in sight, traders are optimistic about further gains. Technical indicators continue to point towards upward momentum, making IOUSDT a standout in recent market movements.

$IO - Supply shock comingIO (Io.net) throwing up a 25% in a day!
GPU staking coins on Solana probably worth keeping an eye on.
Over MIL:1M worth of IO tokens have been staked on Ionet’s staking platform, marking a key milestone in the platform’s growth.
Supply shock of up to GETTEX:17M in buy pressure from validators from the recent gov proposal.
However, price is now being rejected at 4-hour ema200, this is the first test thus a shallow pullback is expected.
Would view the following levels as good area to bid or to go long:
$1.85 - 0.618 fib level
Conservative entry:
$1.76 - 0.50 fib + high volume node (b

IO.net future targetsIO.net is a very promising project similar to Render. Using GPU clusters to help "the internet of gpus" network prospered and also using AI apps through a IO CLOUD interface

IO Trade Setup in 3-hour TimeframeKeep an eye on #IO.
SEED_ALEXDRAYM_SHORTINTEREST2:IO is under a symmetrical triangle pattern and will likely break out above the resistance and rally 20%-25%.
Entry: $1,66 to CMP.
Stop Loss: $1.595.
Targets: $1.86, $1.98, $2.086, $2.153.
Leverage: 5x-10x.
DYOR, NFA.
#cryptocurrency

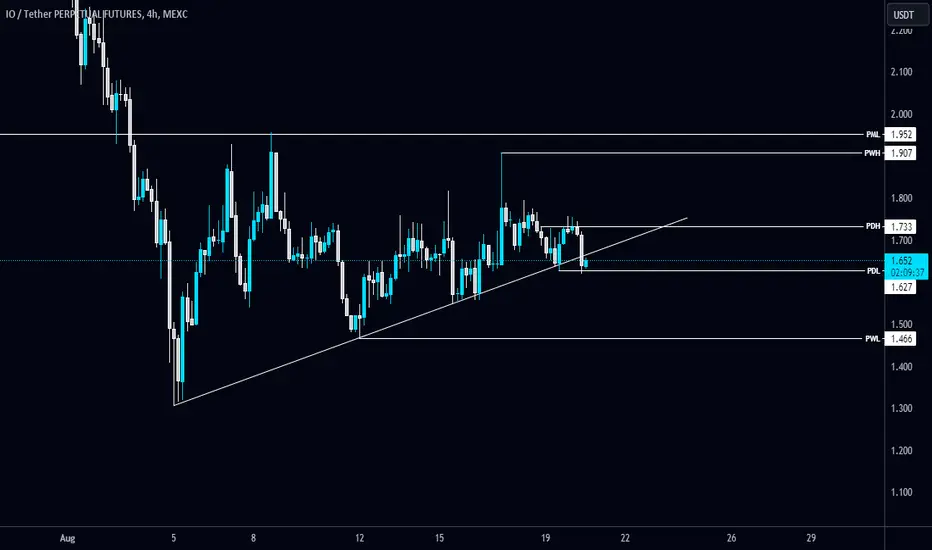
IO/USDT breaks the Diagonal Trendline in 4-Hour TF!#IO/USDT breaks the Diagonal Trendline in 4-Hour TF!
Wait for a successful retest to short $IO. The candle closing above will invalidate it. The local resistance level is PWH $1.907 and the support level is PWL $1.466.
IOUSDT.P: Bullish Momentum Building Above $1.72IOUSDT.P is currently trading at $1.723, and the technical indicators suggest a bullish trend may be forming. The Relative Strength Index (RSI) is approaching the 60 level, indicating increasing buying pressure. The Moving Average Convergence Divergence (MACD) has shown a bullish crossover, with the MACD line moving above the signal line, signaling a potential upward trend. Additionally, the price has consistently held above the strong support zone at $1.70, which has been a key level in maintaining bullish sentiment.
The 50-day Moving Average is beginning to trend upward, reinforcing the idea that the current price level could be the base for a new rally. Volume analysis shows an increase in buying activity, suggesting accumulation by market participants. Moreover, the price action has formed higher lows over the past few sessions, a classic sign of a building uptrend.
Given these indicators, IOUSDT.P is likely poised for further gains, with the next resistance level around $1.80, making this an attractive buy at the current price.

IO still looks bearishWe have a pattern with price-time similarity that looks like a diametric.
The length of each branch is between 22-23 days.
We seem to be in wave C now.
The vertical line is the minimum time that wave C should have.
We are looking for sell/short positions in the supply range.
Closing a daily candle above the invalidation level will violate the analysis.
For risk management, please don't forget stop loss and capital management
Comment if you have any questions
Thank You

IOUSDT.4HToday, I’m analyzing the 4-hour chart of IO against USDT on the Binance exchange. The current price of IO is $1.552, which shows a minor decline of 0.70% recently.
Key Resistance and Support Levels:
The chart identifies key resistance levels at R1 ($1.783) and R2 (higher, not visible on the chart). The support levels are noted at S1 ($1.533) and S2 ($1.269). The current price is hovering just above S1, which suggests a critical juncture; if the price breaks below this level, it might test the lower support at S2.
Technical Indicators Analysis:
• MACD: The MACD line is below the signal line and close to crossing it from below, which could indicate a potential bullish reversal if it succeeds in crossing above. However, both lines are below zero, suggesting that the overall momentum is still bearish.
• RSI: The Relative Strength Index is around 45, which is neither oversold nor overbought. This indicates a relatively balanced market condition but leans slightly toward bearish sentiment.
Analysis:
The IO market is currently in a delicate position, teetering just above the first support level (S1). The proximity to S1 could lead to a decisive move shortly. If the price holds above S1 and the MACD completes a bullish crossover, it might suggest an opportunity for a price recovery towards R1. Conversely, a break below S1 could see the price heading towards S2, signaling a continuation of the bearish trend.
Conclusion and Trading Strategy:
Given the current market indicators and price action, my strategy would involve closely monitoring the price action around S1 ($1.533). If IO holds above this level and the MACD crosses above the signal line, considering a long position with a target near R1 ($1.783) might be a viable approach, placing a stop-loss just below S1 to manage risk. However, if the price breaks below S1, I would look for potential short opportunities, targeting S2 ($1.269) while keeping a close watch on any potential reversal signals.

IOUSDT.Plast my otl for this day , hope you enjoy guys. if you have an oppinion tell me on the chat!

IOUSDT - A Prime Opportunity for Long Term Gains.After a significant correction, IOUSDT is making efforts to reclaim its previous major support level. This is often a positive sign, indicating that the market may be stabilizing and setting the stage for a potential upward move.
IOUSDT is part of a significant GPU project, which adds to its appeal and long-term potential.For those looking to invest, this could be an opportunity to buy IOUSDT and hold it for the long term. Given the project’s potential and current market conditions, long-term holding may yield substantial returns
IOUSDT (1D Chart) Technical analysis
IOUSDT (1D Chart) Currently trading at $3.4
Buy level: Above $3.5 (Buy after breakout)
Stop loss: Below $3
TP1: $3.8
TP2: $4.3
TP3: $5.5
TP4: $6.5
Max Leverage 3x
Always keep Stop loss
Follow Our Tradingview Account for More Technical Analysis Updates, | Like, Share and Comment Your thoughts

Buy Trade Idea for Crypto IO - Capitalizing on PromisingDescription
Crypto IO is rapidly emerging as a promising player in the blockchain space, driven by strong fundamentals that make it an attractive investment opportunity. Key highlights of Crypto IO include:
Cutting-Edge Technology: Crypto IO leverages advanced blockchain technology designed to optimize transaction speed and scalability, offering a competitive edge over traditional networks.
Robust Security: The platform incorporates a sophisticated security framework that ensures the integrity and safety of transactions, providing confidence for both users and developers.
Ecosystem Expansion: Crypto IO is witnessing significant growth in its ecosystem, with a wide range of decentralized applications (dApps) and partnerships being developed, which could enhance its long-term value.
Low Transaction Fees: The network’s design ensures minimal transaction costs, making it a cost-effective solution for various blockchain applications.
Considering these strong fundamentals, Crypto IO represents a solid buy opportunity for investors looking to tap into the growth potential of a dynamic and innovative cryptocurrency.
Disclaimer
Trading and investing in cryptocurrencies involve significant risk and can result in substantial losses. The content provided here is for informational purposes only and should not be considered financial advice. Always conduct your own research, consider your risk tolerance, and consult with a financial advisor before making any investment decisions. Past performance is not indicative of future results, and the value of investments can fluctuate widely.
