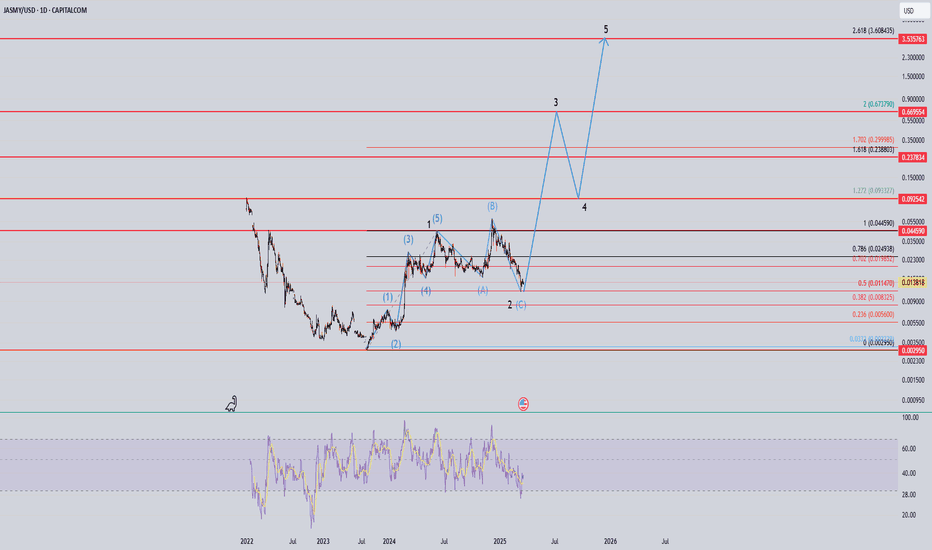
Jasmy to rally to between $0.35-$0.50 at the peak of bull cycleJasmy token has been caught between 2 pivot zones. The price is currently in the support zone between $0.008 and $0.012 . This zone must be defended on a weekly closing basis.
To the upside is resistance between $0.048 and $0.07. Breaking above this resistance, on a weekly closing basis, will like
Jasmy Double Bottom Potential Reversal?Let’s break this down based on the scenario you’ve described and explore what it might mean for Jasmy’s price movement, while keeping it grounded in general technical analysis principles.
Historical Context and Double Bottom Analysis
I’ve noted two key periods:
November 2021 to March 2022:
-Jasmy t
Jasmy Double Bottom Hit?Let’s break this down based on the scenario you’ve described and explore what it might mean for Jasmy’s price movement, while keeping it grounded in general technical analysis principles.
Historical Context and Double Bottom Analysis
I’ve noted two key periods:
November 2021 to March 2022:
-Jasmy t
JASMY Stock Chart Fibonacci Analysis 032025Trading Idea
1) Find a FIBO slingshot
2) Check FIBO 61.80% level
3) Entry Point > 0.014/61.80%
Chart time frame: B
A) 15 min(1W-3M)
B) 1 hr(3M-6M)
C) 4 hr(6M-1year)
D) 1 day(1-3years)
Stock progress: B
A) Keep rising over 61.80% resistance
B) 61.80% resistance
C) 61.80% support
D) Hit the botto
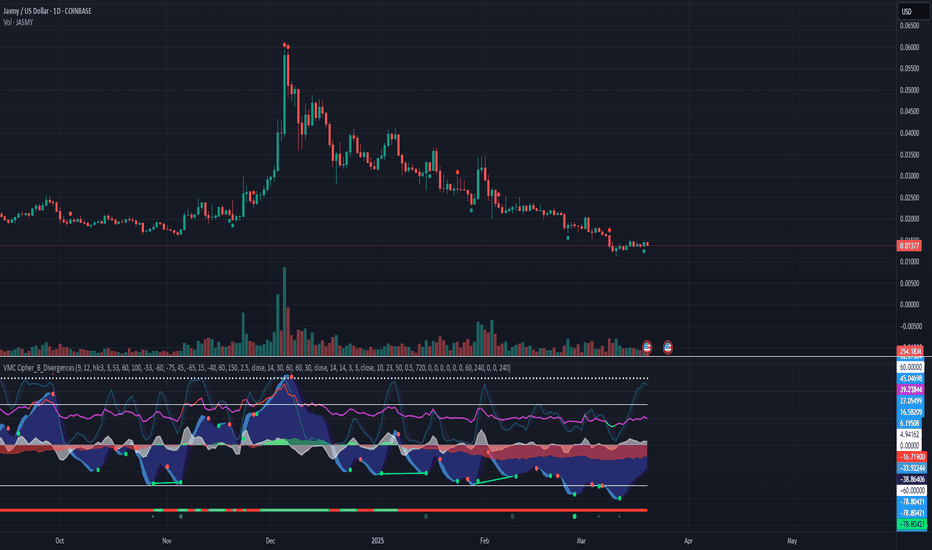
Bottom Found For JasmyJasmy appears to have found its bottom, with capitulation events occurring on February 25th and Sunday, March 9th. On the 4-hour chart, an oversold RSI condition has paired with a bullish divergence, signaling that selling pressure may be exhausted and a reversal is underway. The bulls have taken ch
Bottom Found for JasmyJasmy appears to have found its bottom, with capitulation events occurring on February 25th and Sunday, March 9th. On the 4-hour chart, an oversold RSI condition has paired with a bullish divergence, signaling that selling pressure may be exhausted and a reversal is underway. The bulls have taken ch
Bottom Found for Jasmy?Jasmy appears to have found its bottom, with capitulation events occurring on February 25th and Sunday, March 9th. On the 4-hour chart, an oversold RSI condition has paired with a bullish divergence, signaling that selling pressure may be exhausted and a reversal is underway. The bulls have taken ch
(JASMY) jasmycoinDGT pattern indicator featuring elliott waves. Green diamond is major oversold, green triangles is minor oversold, same for peaks only circles and so on. I'm seeing a lot of oversold signals in cryptocurrency using this indicator, including Ethereum, the blockchain Jasmy is run on as a layer 2 token
See all ideas


