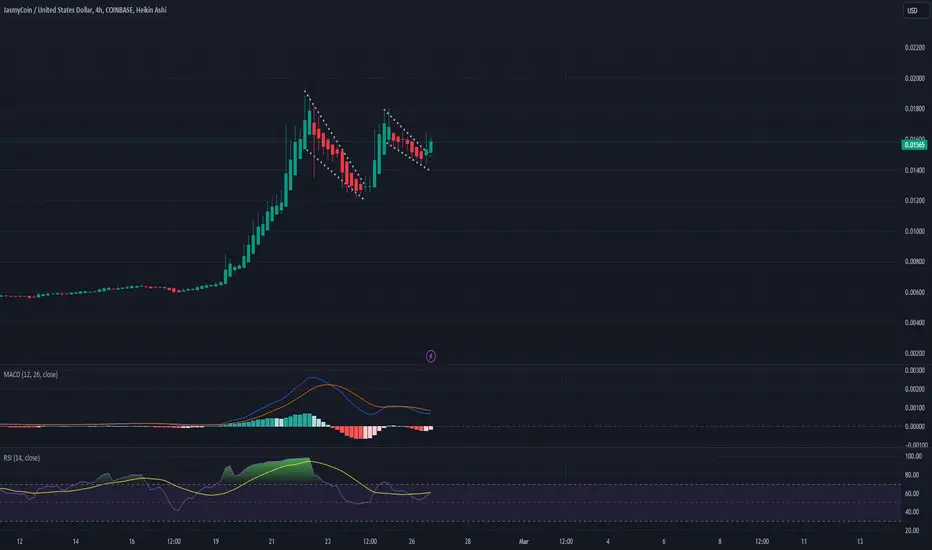
JASMY Set for Breakout? Analyzing Key Levels and MomentumJasmyCoin (JASMY) has been in a downtrend but has recently started to recover. There are two red trend lines indicating an ascending channel, suggesting a potential continuation of the uptrend if the price stays within this channel.
Support Levels:
0.01250
0.01724 to 0.01720
0.00828
0.00306
Resistance Levels:
0.02379
0.03450
0.05012
Price Movements:
The current price is 0.0221.
- The price recently bounced from around 0.01724 and is now facing resistance at 0.02379
- If it breaks above 0.02379, the next resistance is around 0.03450 and potentially 0.05012
There is a noticeable increase in volume during the price recovery, indicating strong buying interest.
Bullish Scenario:
- If the price breaks and closes above the 0.02379 resistance level, it could target the
0.03450 resistance and potentially reach 0.05012 if the bullish momentum continues.
- The ascending channel suggests that as long as the price stays within this channel, the uptrend is intact.
Bearish Scenario:
- If the price fails to break the 0.02379 resistance and falls below 0.01724, it might test the lower support at 0.01250 and possibly 0.00828.
- The stochastic oscillator's behavior should be monitored for potential bearish crossovers that could signal a downturn.
JASMYPERP trade ideas

Jasmy Bullish MonthJasmy Bullish Month
Currently trading at $0.020.
Recovered from $0.015 to $0.022.
All time high at $0.35.
Stoch Rsi = Bullish
Rsi = Neutral > Bullish
Macd = Neutral > Bullish

JASMY (JASMY)Red line appears from the pattern of two moving average lines. No one ever uses lines to connect those points so I did.

Jasmy did quite well in during alt coin dump this month.Jasmy was resilient during the dump on April 12th.
The Elliott Wave count looks promising.
If Bitcoin reaches a new all-time high, Jasmy will surge.

JASMY (JASMY)Arrays, Moving Average and High label makes same view. This kind of looks like an on chart DMI in a way. roughtdraft indicator progress...
the lines are getting are bunched together now.
I see jasmy as the freedom to protect ideas, ideas in business, ideas in one's own personal life, an anti-communist statement of freedom.

JASMY 'LIONS PAW'There are no animals or humans that have six fingers to my knowledge unless by accidental anomaly. For that reason I think it's only natural to see the price of Jasmy going up. On the image it is easy to see the image in the chart. Based on where BTC is headed it wouldn't make sense to see the price drop.

Jasmy (JASMY) Drawing on the charts, nothing else to it than that.
Glassy, Grassy, Miami, ascii, chassis, tallahassee.
...
For some reason the circles always shift whenever I try to use them as a published idea. Trading View should fix that. The circles should line up with the highs of each section.
...
sassy, classy, grammy.
Some words that rhyme with Jasmy.
...
Let's ignore those that refer to anger or violence.

✅ 4R MOVE, TRADE REVIEW: $JASMYUSDT - GUARANTEED WIN- JASMYUSD has soared to +8.72% since i issued my alert in the morning
- Currently the idea represents a 4x move, this is the Maximum Favorable Exersuion (MFE)
- Generally when. a trade receives a 2x I do 1 of 2 things:
1) Either reduce half
2) Bring stop loss to breakeven
/Sometimes I use more avanced techniques but not the topic of conversation here/
Since JASMYUSD is very speculative name that can move a lot, I would look to use technique no.2 2) to improve my risk reward management and improve my worst case scenario.
Why 2) and not 1) - well, I knew the stock is thinned and as said in the previous alert, I did position size for this and will be willing to play the hand on larger move of smaller position size.
- what is important is to manage the risk of the trade and explained in this idea and the previous ideas linked is how you can manage it.
You can review the timestamps of the ideas and hence see that this is real time advice.

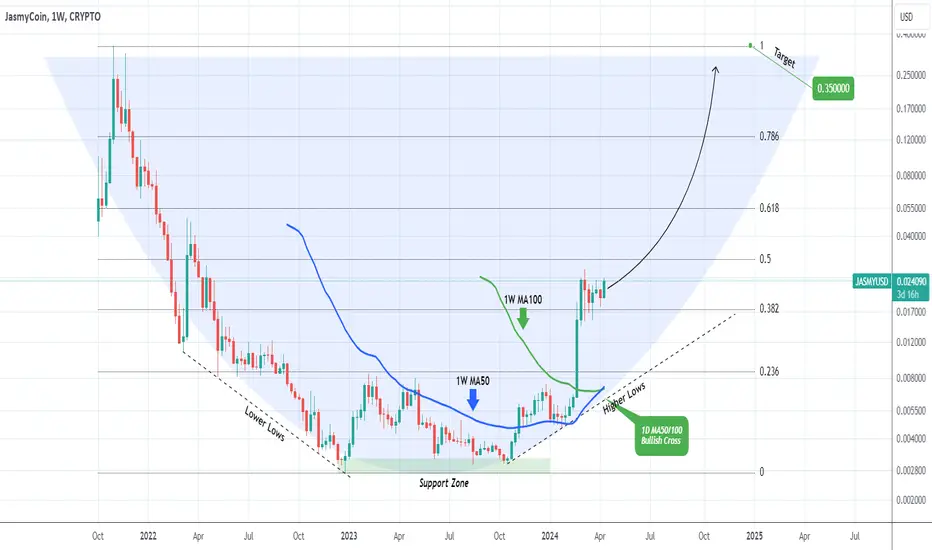
JASMYUSD Giant Cup leading straight to ATH.JasmyCoin (JASMYUSD) is picking up the pace again after 6 weeks of consolidation. The long-term pattern that is emerging is a Cup (potentially we may see a Handle at the top) and this sideways trading the new accumulation before the next Bullish Leg.
Technically it should continue filling up the Fibonacci levels as gaps, with the next being the 0.618 Fib (0.055) and the 0.786 (0.1200) all the way until the All Time High (ATH). As a result our long-term Target is 0.3500.
-------------------------------------------------------------------------------
** Please LIKE 👍, FOLLOW ✅, SHARE 🙌 and COMMENT ✍ if you enjoy this idea! Also share your ideas and charts in the comments section below! This is best way to keep it relevant, support us, keep the content here free and allow the idea to reach as many people as possible. **
-------------------------------------------------------------------------------
💸💸💸💸💸💸
👇 👇 👇 👇 👇 👇
✅TRADE REVIEW: $JASMYUSD- Opening a position.
- Very risky so I have positioned sized accordingly
- Very tight stop as well
I want to see this GO right away and have no patience
It is a lower quality name in an uncertain market.
I see above average volume moving up.
Consturctive pattern.
If you are aware of the High Tight Flag (or PowerPlay) concept in stocks, I use this analogy when I trade crypto. The HTF requires a +100% move up (powerful) and less than 20% correction - indicating stong buyers piling into the stocks. I extrapolate this logic into the more volatile crypto names as I would like to see less than 20% retracement of the gain. To explain further, JASMYUSD has soared +450% since Feb2024. I would take 20% of 450% and allow this stock to correct up to 90% to be a valid base. Currently it has corrected only 40% and is staring to move up with great volume patterns. Hence why I have been willing to risk capital into this TRADE.

Jasmy Bullish AprilJasmy Bullish April?
Currently position 100 on coinmarketcap.
900 million marketcap. Lots of potential for growth.
Stoch Rsi = Bullish
Rsi = Neutral > Bullish
Macd = Neutral > Bullish

JASMYexpecting something like this from JASMY.
Right now we are in w4 of 3 soon to start wave 5 of 3.

JASMYCOIN (POSSIBLE IDEA)Could this be the direction Jasmy is going? An idea I've come up with--. I can't explain much on the direction of jasmy. The break into the red circle and falling out only to repeat makes sense but once the graph passes the red circle there is no break, which makes sense. I used a previous incline wedge to measure a possible view for the future with a reverse coloring to account for what it would be like. The more Jasmy loses the closer red is of course so using that logic it's a guess on if Jasmy were to move forward and up then there is a small window based on this indicator guess.

Jasmy breakout sometime around middle of May ?Hello Jasmy Bulls !! Looks like a Bullish Pennant is being created, if that's the case we are looking for a breakout around middle of May....

JAS moving down to as lowest 0.02083Short position: Target is calculated by Percentage in Price with ATR. Nasdaq sessions was used to calculate Entry and Stop.
Those who take high impact risks can enter at their own risk at entry price.
Pips, ATR with Nasdaq sessions read target at 0.02083

REJECTED ! Ascending parallel channel still runningSeems that the parallel ascending channel is still running, there was some golden entry points.
Another light string can potentially be drawn. To monitor ! Not a financial advice ..
Oh and I'm definitly BULLISH with this strong rejection

$JASMYJust an idea of trend for #JASMY.
Considering the supports and the trend, in my opinion it's a great buy opportunity for the next bullpen ahead (may-july 2024 IMO)

INVERTED HAMMER CLOSED/29 pips with ATR $0.02775 Two long positions with new targets. Inverted hammer candlestick closed on a 1hr. 1 key level at 0.01887.
Reversal Pullback confirmed by inverted hammer otherwise pay attention to percentage in price with Actual True Range.

JasmyCoin graph drawingDrawing on JasmyCoin graph. I drew a prediction chart based on the idea Jasmy would maintain a price above 0.01 cent and continue the pattern to remain atop the 0.02 cent price based on the understanding of the current chart progress of Bitcoin and momentum found within the greater cryptocurrency ecosystems and from those conclusions tried to produce a graph to show finding the next dip to buy would be harder than it seems because the graph incline degree will be such that dips are going to be harder to see than in a usual general purpose trend where the price action of chart is much flatter over longer periods of time.

$JASMY to 2CSEED_DONKEYDAN_MARKET_CAP:JASMY is completing a Large Inverted Head & Shoulders Bullish Pattern, with the final leg a Nestled another Inv H&S this one picked up by A.I.
AI also set the green target too at 0.01860 but I think if we make it that close we bound to ring the 2c!

$JASMY Targeting ATH's (Breakout or Breakdown) ? ** SEED_DONKEYDAN_MARKET_CAP:JASMY UPDATE**
- Invalidating a H&S (Head & Shoulder) pattern with Jasmy climbing towards ATH's of $0.01700.
Please understand that Jasmy will be testing next resistance of 0.01645 that it must break closing above with a Daily candle then holding to continue towards $0.01700. We will be seeing Jasmy price action continuously retracing to the orange trendline then working on creating HL's (White Circle's) to reach the higher targets towards ATH's. We are also seeing the formation of an Ascending triangle to meet the LH's (Pink Circles) coming from above with an eventual breakout to the upside or breakdown to lower support lines.
I will update as the price action on my chart provides new details.

JASMY Bullish SpringJASMY Bullish Spring
Low marketcap opportunity
Trading at $0.015
Macd Neutral > Bullish
Rsi = Neutral > Bullish
Stoch Rsi = Bullish
Jasmy bullThis coin is likely to hit its beginning price of $4 I highly advise buying now and holding daily time frame shows a large order block surging from under 1 cent may not come back down for a long time ignore online price predictions
