Frankly, I don't feel like explaining, the chart says it all !!JASMY is forming a falling wedge on Daily timeframe , Up we go if we do breakout. the price can be bullish and I expect the price to go up to the Fibonacci line of 0.618 = 0.027 Stay tuned for more updates, thanks.
✨We spend hours finding potential opportunities and writing useful ideas, we would be happy if you support us.
Best regards CobraVanguard .💚
_ _ _ _ __ _ _ _ _ _ _ _ _ _ _ _ _ _ _ _ _ _ _ _ _ _ _ _ _ _ _ _
✅Thank you, and for more ideas, hit ❤️Like❤️ and 🌟Follow🌟!
⚠️Things can change...
The markets are always changing and even with all these signals, the market changes tend to be strong and fast!!
JASMYUSDT.PS trade ideas

JASMY AT A PERFECT ENTRY POINT FOR A LONG POSITION! TRADE PLANTechnical Analysis by Blaž Fabjan
Pattern Identification:
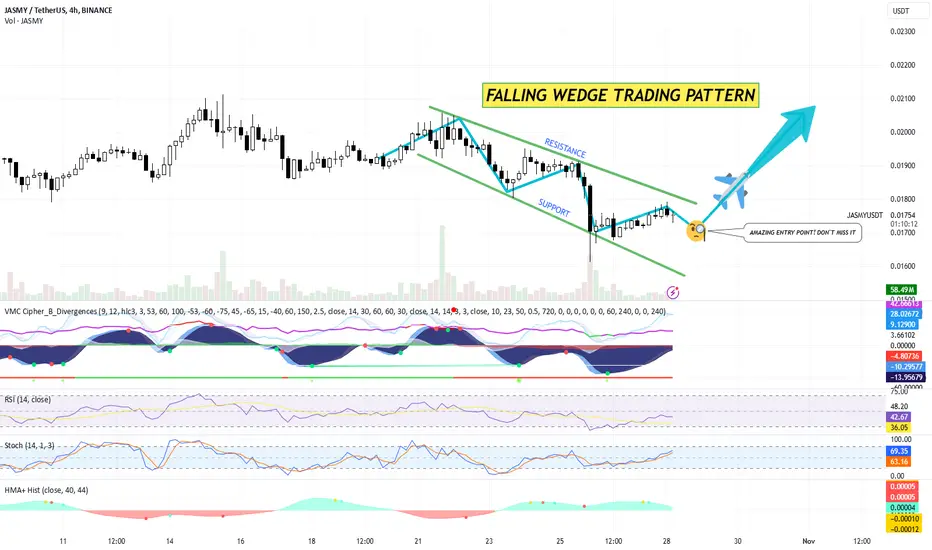
The chart displays a falling wedge pattern , a bullish reversal pattern often signifying a potential trend change from bearish to bullish.
The price action is currently testing the upper boundary of the wedge pattern, indicating that a breakout could be imminent if there’s sufficient buying momentum.
Support and Resistance:
Support Line: The lower green line in the falling wedge acts as support. This line has been consistently respected, indicating strong buying interest at those levels.
Resistance Line: The upper green line marks the resistance level within the pattern. A breakout above this line would be considered a strong bullish signal.
Volume Analysis:
There’s a noticeable decrease in volume within the wedge, which aligns with typical falling wedge characteristics. Look for a volume increase on a breakout to confirm the move.
Indicators:
VMC Cipher: Divergences and buy signals have been detected, showing signs of potential momentum shifts.
RSI: At around 41.07, the RSI is approaching the neutral zone (50), suggesting the potential for further upside if it breaks above 50.
Stochastic: Currently around 60.48, indicating upward momentum and possibly further bullish action if it continues moving up.
HMA+ Histogram: Showing minor bullish signals that could align with a breakout confirmation.
Entry Signal:
The wedge breakout zone is highlighted as an “Amazing Entry Point.” The suggested entry is around the resistance line in the pattern, currently close to $0.01743.
Trading Plan
Entry:
Enter a long position once JASMY/USDT breaks and closes above the falling wedge resistance line with increased volume. This would be near or slightly above the $0.0175 level, depending on price action confirmation.
Stop Loss:
Place a stop loss slightly below the wedge’s recent support level or just below the most recent swing low at around $0.016 to mitigate risk.
Take Profit Levels:
First Take Profit (TP1): Set around the recent swing high near $0.019.
Second Take Profit (TP2): For a more extended target, aim around $0.0205, where the price previously found resistance.
Final Take Profit (TP3): Around $0.022, aligning with previous higher resistance levels.
Risk Management:
Calculate position size to risk no more than 1-2% of your trading account per trade.
Monitor volume closely, as a breakout with low volume may indicate a false breakout, in which case exiting the trade early could be advisable.
Alternative Scenario:
If the price fails to break the resistance and moves back within the wedge, refrain from entering. In this case, wait for a possible retest of the support level around $0.016 as a secondary entry point.
Summary
Pattern: Falling Wedge (Bullish).
Buy Zone: Above $0.0175, confirmed with volume.
Stop Loss: Below $0.016.
Take Profit Targets: $0.019 (TP1), $0.0205 (TP2), $0.022 (TP3).
btw: VERY GOOD ENTRY POINT AT THE MOMENT!
JASMY TECHNICAL ANALYSIS + TRADE PLAN (at the breaking point)Let’s break down the technical analysis for JASMY/USDT (Blaž Fabjan)
Falling Wedge Pattern:
Resistance: The upper trendline of the wedge shows that price has consistently been making lower highs, but the slope is not steep.
Support: The lower trendline connects lower lows, but the declines are shallow, indicating sellers are losing strength.
A breakout from the wedge, especially on strong volume, often leads to a bullish trend reversal.
Volume:
The volume bar shows moderate activity, but for the breakout to be valid, you will need confirmation through an increase in trading volume.
Current volume is around 34.85M, which should increase significantly during a confirmed breakout.
Momentum Indicators:
VMC Cipher B Divergences (Market Cipher Indicator):
Shows red dots indicating bearish divergence. However, this indicator could shift quickly depending on market movement.
Relative Strength Index (RSI):
Currently at 41.82, it is in the lower range of the neutral zone, indicating oversold conditions. A move above 50 would strengthen the bullish case.
Stochastic RSI:
At 13.47, this indicator is signaling extreme oversold conditions, which may imply that a rebound is likely.
Hull Moving Average (HMA):
Displays slight bearish momentum (red), but this could reverse once a breakout happens from the wedge.
Price Levels to Watch!
Breakout Level:
If JASMY breaks the wedge's upper resistance (approximately 0.0193 - 0.0195 USDT), this would confirm the pattern. A sustained breakout with high volume could push the price higher.
Support Level:
Immediate support lies near 0.0188 USDT, based on the lower wedge trendline. A breakdown below this level could invalidate the bullish reversal.
Resistance Level (Post Breakout):
After breaking the wedge, the next target is 0.0210 USDT, a key resistance level highlighted on the chart. A further target can be 0.0220 USDT.
TRADING PLAN
Entry:
Aggressive Approach: Enter at the current level or as soon as price reaches near the upper wedge resistance (0.0193 - 0.0195 USDT) with a tight stop loss.
Conservative Approach: Wait for a confirmed breakout above 0.0195 USDT with increased volume, followed by a retest of the breakout zone.
Stop Loss:
Place a stop loss just below the lower trendline of the wedge, around 0.0185 USDT, to manage risk in case of a breakdown.
Take Profit Levels:
First Target: 0.0210 USDT (resistance from the previous highs).
Second Target: 0.0220 USDT (next significant resistance).
Long-Term Target: If the breakout is strong, higher levels like 0.0230 USDT could come into play.
Risk Management:
Risk no more than 2-3% of your trading capital on this setup.
Adjust the stop loss to breakeven once the price hits the first target.
Exit Strategy:
If the price fails to break the wedge within the next 1-2 candles or breaks below 0.0185 USDT, consider exiting the position to minimize losses.
Trailing stops can be used to lock in profits as the price moves toward 0.0210 USDT and beyond.
The falling wedge formation suggests that a bullish reversal could be imminent for JASMY. However, traders should watch for confirmation through a breakout above the resistance line with strong volume. Utilize proper risk management to protect against downside risk while positioning for potential gains.

JASMY Long Position (Accumulation Breakout)Market Context: JASMY is showing bullish signs, moving out of its accumulation phase with a strong daily close above the EMA-21. The EMAs are aligning favorably, providing a solid entry for a long position.
Trade Setup:
Entry: Around $0.021 to $0.019.
Take Profit:
First target: $0.024
Second target: $0.028
Third target: $0.032
Stop Loss: Daily close below $0.018.
This setup takes advantage of JASMY’s potential breakout from accumulation into an upward trend. #JASMY #Crypto #Breakout

JASMY ANALYSIS📊 #JASMY Analysis
✅There is a formation of Descending triangle pattern on daily chart 🧐
Pattern signals potential bullish movement incoming after a breakout
👀Current Price: $0.01950
🚀 Target Price: $0.03150
⚡️What to do ?
👀Keep an eye on #JASMY price action and volume. We can trade according to the chart and make some profits⚡️⚡️
#JASMY #Cryptocurrency #TechnicalAnalysis #DYOR

bullishWith the breakout of the trendline, the price has the potential to reach the Fibo range of 50 to 62.

JASMY is Bullish now & many Traders don't see it !!JASMY is forming a falling wedge on Daily timeframe , Up we go if we do breakout. the price can be bullish and I expect the price to go up to the Fibonacci line of 0.618 = 0.027 Stay tuned for more updates, thanks.
✨We spend hours finding potential opportunities and writing useful ideas, we would be happy if you support us.
Best regards CobraVanguard .💚
_ _ _ _ __ _ _ _ _ _ _ _ _ _ _ _ _ _ _ _ _ _ _ _ _ _ _ _ _ _ _ _
✅Thank you, and for more ideas, hit ❤️Like❤️ and 🌟Follow🌟!
⚠️Things can change...
The markets are always changing and even with all these signals, the market changes tend to be strong and fast!!

JASMY Blow Off Stop?I have no idea what Jasmy does.
Bullish price structure is bullish price structure.

Jasmyusdt Buy opportunityJASMYUSDT is displaying a strong cup and handle formation, presenting a good accumulation opportunity within the highlighted zone. The provided targets on the chart align with the coin’s potential, making it a worthwhile hold.
Previous analysis, which identified an Adam and Eve pattern, played out successfully.
The current strategy is to hold for at least 4 months, observing how the market develops.

JASMY About To Start a New Impulse 📈 Clear Falling Wedge Formed At The JASMY Chart And The Price Breakout From The 0.023$ Resistance Line And Today We Had a Breakout From The Main Trend Line Too, Expect a New Bullish Rally Toward a 0.027$, 0.0335$ And 0.0385$ Soon

#JASMY Breaks Out of the Falling Wedge: What's Next?Yello, Paradisers! Are you ready for what's brewing with #JASMYUSDT? The #JasmyCoin is at a crucial tipping point and about to explode:
💎Currently, #JASMY is sitting at a key demand zone of $0.0245, forming a Falling Wedge pattern. This could be the calm before the storm. A potential breakout above this level might signal a major momentum shift in favor of the bulls. If the demand holds, brace yourself for a strong bullish move that could catch many off-guard.
💎For the bullish scenario to play out, #JasmyCoin must break above $0.0245. If it does, the next target is the internal resistance zone at $0.0298. At this level, we could see a significant rally, so it's crucial to keep an eye on it.
💎However, we can't afford to get too comfortable just yet. If the demand zone doesn't hold, the price could pull back to the lower support area around $0.0201. And if that level breaks too, the next critical demand zone to watch will be $0.0178.
💎A daily close below $0.0178 would invalidate the bullish outlook and might signal a deeper correction. Stay alert, as the market could turn quickly.
Patience and discipline are the keys in navigating these market conditions.
MyCryptoParadise
iFeel the success🌴

JASMY price pattern analysisIt is about reading the price pattern and the result of the indicators
I will only share with you what the result of the analysis shows.
This could be wrong. MD

JASMY Analysis - What Shall we Expect !!!JASMY continues to consolidate within a bullish symmetrical triangle pattern.
The ongoing consolidation maintains a bullish outlook for JASMY in the near term👀
✨Traders, if you liked this idea or have your opinion on it, write in the comments, We will be glad.
_ _ _ _ __ _ _ _ _ _ _ _ _ _ _ _ _ _ _ _ _ _ _ _ _ _ _ _ _ _ _ _
✅Thank you, and for more ideas, hit ❤️Like❤️ and 🌟Follow🌟!
⚠️Things can change...
The markets are always changing and even with all these signals, the market changes tend to be strong and fast!!

Jasmy usdt
Jasmy Getting Ready For 10% Bullish Wave Consolidating In Descending Channel Incase Of Successful Breakout Expecting Solid Bullish Rally

JASMY ROTATION ROTATION ROTATION My previous post expected a full rotation to the VAH, and we are now in the verge of completion.
VAH lines up with a weekly close/open. This level presents level of reaction.
This is an obvious short. Although, this setup should be taken at the start of next week candle for a better SL

JASMY - More down side ??? in bull phase!!!THE simplest strategy is the best strategy.
the plan is proposed in the chart.
lets execute it.

JASMY rotataionSupport is retested once again with confluence with a old range's VAL.
This setup has low risk to high reward ratio.

JASMY Price Update & Analysis in a Daily TimeframeHello everyone, I’m Cryptorphic.
I’ve been sharing insightful charts and analysis for the past seven years.
Follow me for:
~ Unbiased analyses on trending altcoins.
~ Identifying altcoins with 10x-50x potential.
~ Futures trade setups.
~ Daily updates on Bitcoin and Ethereum.
~ High time frame (HTF) market bottom and top calls.
~ Short-term market movements.
~ Charts supported by critical fundamentals.
Now, let’s dive into this chart analysis:
As per our previous analysis, JASMY has already reached the lower support at $0.01632. A decent rebound followed this but failed to break above the resistance trendline at $0.0245 and the 100 EMA. The rejection led to multiple days of decline, and the price continued to drop further.
The price is approaching the primary support range of $0.015-$0.0166. If JASMY breaks down below this range, a drop to the lower support between $0.0107 and $0.012 is likely.
Key levels:
- Primary Support: $0.015-$0.0166.
- Lower Support: $0.0107-$0.012.
- Resistance: $0.024 & 100 EMA.
DYOR. NFA.
Please hit the like button to support my content and share your thoughts in the comment section. Feel free to request any chart analysis you’d like to see!
Thank you!
#PEACE

MUST LONG JASMY AT .007Here we have one of the typical JASMY charts that DO NOT give historical price data. GATEIO is the only chart I have found with historical price data. I have this chart and the GATEIO chart up side by side on JASMY constantly. You can see in this weekly chart, the cloud dips all the way down to .006-.007 for one week only (next week). On the GATEIO chart, it is similar but with the historical data, we can see that the level lines up perfectly with a much older wick and is the macro support level of the adam and eve structure it broke out of. I have been eyeing this macro inverse HS setup since 2023 while I was accumulating JASMY in the lows. There is a possibility with BTC losing monthly support for a nice big dump and JASMY has lost monthly support as well. Bottom of the weekly cloud is a must long for me and will put me in HODL mentality on this coin. Good luck. I will post the gateio chart below for reference. Edge

JASMY analysis (4H)As you can see, JASMY is under correction. Price is creating an internal pullback.
At the bottom of the chart there is a liquidity pool, which we indicated by ($$$).
After hitting the supply box, the price is expected to move towards the POI and sweep the liquidity pool.
We are looking for buy/long positions in the POI range.
Closing a daily candle below the invlidation level will violate the analysis.
For risk management, please don't forget stop loss and capital management
Comment if you have any questions
Thank You

JASMYUSDT: Bullish Trend (Inverse H&S Pattern) JASMY is moving in uptrend after the touch the strong support area, and currently its forming Inverse H&S Pattern with Bullish Divergence on 1hr time frame, these all sign are the confirmation of the bullish trend so we will wait for the break of the nick line OR can be take a long trade on CMP, with proper Risk Management.

JASMY Update — Let's Clear 0.0245 And Start Marching!JASMY printed a pattern similar to many other tokens:
• It dipped below its support at 0.02 but reclaimed it quickly
• Afterward, the price started to surge and is up ~20% concerning the support
However, compared to the top gainers, JASMY hasn't printed one of those massive candles yet.
This might change soon.
Currently, JASMY trades slightly below 0.024, with its major resistance at 0.0245. Historically, a break of this level has led to a rapid advance beyond the 3-cent level.
The main deficit right now is volume. JASMY has seen a relatively low volume since its pump in June. Of course, the volume is also lower due to the weekend.
Therefore, I'd be surprised if we saw a big surge during the next 36 hours and consider it more likely for the beginning of next week.
Anyway — from my point of view, it is a question of when, not if!

Jasmy | Reversal Pattern, Price Map & Short-Term TargetHello dear reader, how are you feeling?
Jasmycoin, the chart shows much that needs to be considered. It is a mixture of bullish developments with bullish potential but a risk of unexpected change... Let's get to it and see what the JASMYUSDT chart says.
Notice the "lower support" line, black. This level has been holding since March 2024.
When Jasmy dropped in August, it bounced off this line and produce a higher low. This is a bullish development and defines this level as relevant for any downward move.
Right now we are seeing a reversal pattern, Adam & Eve, after a major drop. This pattern leads to higher prices.
While higher is possible, it is hard to see "long-term" higher here.
We are more likely witnessing the start of a bullish wave that will invariably be followed by a strong bearish move. The bearish move will be followed by an accumulation phase and then sustained growth.
This is based on the fact that the bounce is happening at relatively high prices and a major peak is just a few months away. This peak, or half through it, can work as strong resistance; this is depicted on the chart.
This chart is on a decision point so things can quickly and easily change.
Namaste.
