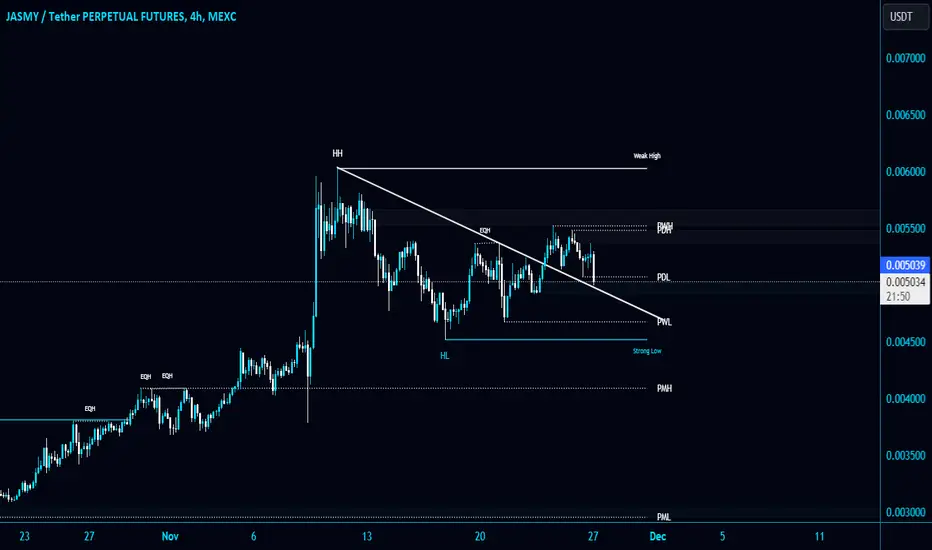
#JASMY/USDT is testing the Diagonal trendline and PDL #JASMY/USDT is testing the Diagonal trendline and PDL support level in 4-Hour TF!
Wait for bounce to long $JASMY. The local resistance level is PWH $0.00554.
JASMYUSDT trade ideas
Jasmy Coin next leg upJasmy Coin 2-3 X November
Currently in correction / reversal.
Stoch RSI Bullish
Rsi Neutral
Macd Reversal

ReadyDO NOT FORGET USING A STOP LOSS
Warning:
This is just a suggestion and we do not guarantee profits. We advise you analyze the chart before opening any position.
I hope you are always profitable

Jasmy Eyes 1 Trillion! Will Jasmy reach it's goal of 1 trillion!? Comparing Jasmy to one of my other favorite projects Fantom I have come up with this approximate number when comparing the data!
The simple comparison is in the chart and from the high from the initial move down is made. Approximately from that point its was 880 days and a 7500% rise... I feel 1 Trillion$ companies will come more and more frequent as time move forward. From the S&P500 to BTC to ETH to FTM the speed at which these assets move in terms of the charts seem to accelerate and it is not out of the realm of possibility that some companies will fast track to these world class evaluations..
We are in the very infancy of Blockchain Technology don't let the fud prevent you from Valhalla!

JASMY next movement..JASMY breakout done,now we are waiting for the pullback and price reaction to the ceiling of the broken triangle

Jasmy Long-Term Bullish ChartJASMY Long-term Chart
Has Jasmy bottomed?
Jasmy went from 0.40 to 0.0027.
Currently trading at 0.005.
Stoch RSI bullish

JASMY will be very profitableBy checking Jasmy's chart, we can see that a double correction is forming in the chart, and the second part of this correction is a diametric.
It seems we are now at the end of wave f of this diametric.
If the g wave is hit and my wave count is correct, you can look for buy/long positions in the green box.
For risk management, please don't forget stop loss and capital management
When we reach the first target, save some profit and then change the stop to entry
Comment if you have any questions
Thank You

JASMY COIN 2 XJASMY COIN 2 X
Is Jasmy coin breaking out the Triangle?
RSI neutral
RSI Stoch neutral
Macd neutral

JASMY NEXT LEG UPJASMY NEXT LEG UP?
Retracement complete and new leg up?
Sitting at 200 million mcap approx
Stoch RSI daily at the bottom > bullish
RSI Neutral
Macd Neutral

#LQR #TOBTC #Jasmyin these time frame 3Day , Jasmy is on a Trading ZOne area which is painted
for now first important support is around 0.003553 - 0.003904
You mat add this level to you'r Watchlist

JASMYUSDT"As we enter the bullish season, the initial target to aim for is
target : 0.1 0.5 1.0 🎯.
This is based on a combination of technical analysis indicators and market trends.
However, it's important to approach trading with caution and adapt to changing market
conditions.
Keep an eye on key support and resistance levels, as well as any significant news or events that may impact the market.
Remember to use proper risk management techniques and consider setting profit targets along the way.
Happy trading!"

Jasmy - The $1 CircleAll key levels are in the chart. I count 5 waves down, so correction ended 2023. 1 to 2 year pump to $1 is what i forecast...

Jasmy moving up?we've got a buy print for Jasmy after a very long time. Anything aboev 0.06 I expect a great fireworks. Remember ILV. It's more than 60% now.

Jasmyusdt Trade opportunityJasmyusdt is currently trading within an ascending broadening wedge formation. The immediate support for the price is the pattern bottom trendline, while there is a lateral weak resistance zone around 0.007221.
If the price breaks above this level, the major immediate target for the price is the local resistance area towards 0.015927. The final setup target is the important supply zone around 0.052032.
However, traders should keep an eye on the major support zone as it is a strong support level that, if broken, could lead the price to test a major demand trendline zone.
Therefore, it is important to watch the price action carefully and consider the risk-reward ratio before making any trading decisions.

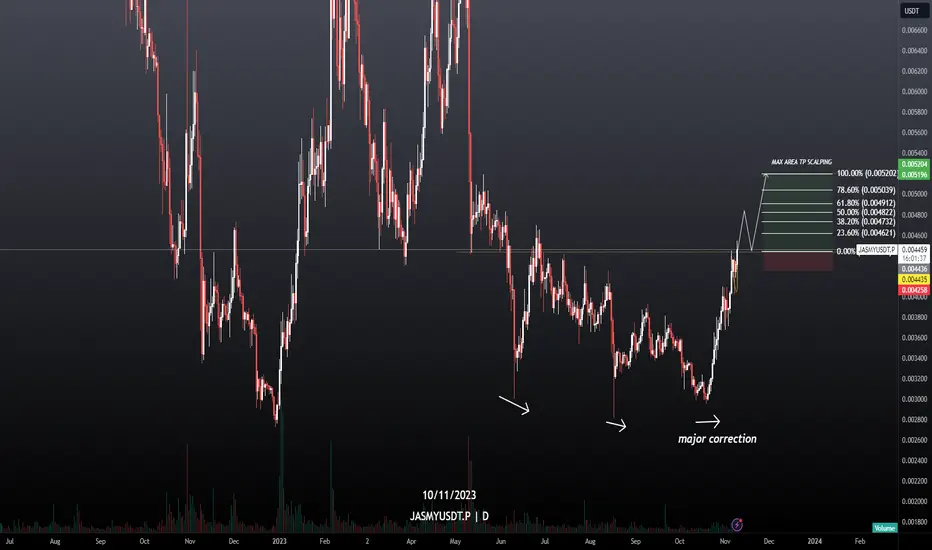
JASMY USDT PERP Hello Trader BINANCE:JASMYUSDT.P
the correction phase area of this jasmy pair already has a point for the bullish area and the max target area for scalping at 0.005204.
seen from the major correction or the bottom area of the daily close candle is already strong for bullish. but if you want to max the area for daily 0.007172, the daily just needs time to rise.
Please add a comment and Positive feedback and
constructive criticism are important to authors and the
community.
Disclamer: Not Financial Advice
$jasmyJasmy is great project with venture capitals backing it.
If you want to get in on tech like Ubber and Lyft before it started, collect some tokens.

Jasmy Signals Green: Buy Now, Thank Me Later!"Welcome to our crypto exploration hub! We're here to navigate the exciting world of digital assets, providing you with comprehensive insights into market dynamics and potential trading opportunities.Our mission is to decode the crypto market's mysteries and equip you with the knowledge you need to make informed investment choices. From the latest developments in Bitcoin to the hidden potential of various altcoins, we're your trusted source for daily technical analysis.While technical analysis is a valuable tool, it's important to remember that it's just one piece of the puzzle. We encourage you to take a well-rounded approach to your investments, considering factors like macroeconomic trends, news, and community sentiment.Join us for the freshest analyses, and don't hesitate to join the conversation in the comments below. Keep in mind that our content is purely for educational purposes and should not be construed as financial advice. Always integrate it into your broader investment strategy."

JASMY BreakoutJASMY Breakout from falling wedge… HOOK and JASMY PA an price structure pretty the same and I expect both of them to have good performance soon….. Wait for retest of the falling wedge and take a long from there…..
Follow for more market update

VOLUME INCREASING ON GATEIO CHARTJASMY has been in a clear consolidation for months now and once again testing the lows. However, the Gateio chart is showing something interesting on the volume. I do not see it on other charts. IMO, the GATEIO chart is the best for JASMY as it has all the history compared to others so I feel this volume indication is prudent. Since it has been months in this zone without a new low, and still quite a bit off the low, starting to buy spot DCA. Invalidation would be a daily close under All time Low.

JASMY SHORTanother break of structure. still on a bearish move.
expecting to create a bearish engulfing here and set a limit order.

JASMYUSDT Possible long position developing As we can see from the chart, JASMYUSDT has reached a daily support level. After a big push into support it created an inside bar. The following candle has created a false breakout from this inside bar and this can be a great signal for a trend reversal.
I need to wait for the close of this bar to add confirmation to the trade. If this candle closes as a false breakout candle i will be looking to enter a long trade into the 50% and 61.8% area.
If the candle closes below the inside bar i will not be taking the trade and looking at a possible short into resistance.
Good Luck!

JASMY ANALYSIS (4H TF)From where I entered "Start of correction" a diametric pattern seems to have started.
We now seem to be in wave e of this diametric. The red zone is our resistance zone, which is expected to push the price down. At the bottom we have a liquidity pool which I have shown in $$$.
For risk management, please don't forget stop loss and capital management
Comment if you have any questions
Thank You

ULTIMATE DOUBLE BOTTOMAs mentioned by many in tradingview, Jasmy has bullish divergence all over the chart. One more wick down to test that key low might be in order before up. Macro adam and eve in play.
Bids are set.
