JASMY - Further upside expected
Jasmy broke the wedge from my last post with an impulsive wave which is now being corrected.
Higher probability is for another leg to the upside, targeting 0.0057 resistance.
We also have 0.0046 just below which could provide a shield for long trades.
JASMYUSDT trade ideas

RLinda ! JASMYUSDT-> Attempt 1. Trend change phase JASMY breaks through the resistance of the descending range. Price updates the 1-week high and forms a retest. What to expect from the bulls?
The coin breaks through the 0.0049 level and forms a consolidation above the level. There is a chance of decline to the previously broken resistance line, but the fact that the price is in the trend change phase already allows us to look for areas to open the deal.
Consolidation above the level of 0.0049 opens us the potential for growth. The medium-term target is the resistance level 0.0058, the long-term target is the liquidity zone 0.0068
Regards R. Linda!

Jasmycoin Breaking descending Channel Breaking descending channel in h4 timeframe incase Of successful Breakout expecting 40 to 45% Bullish Move

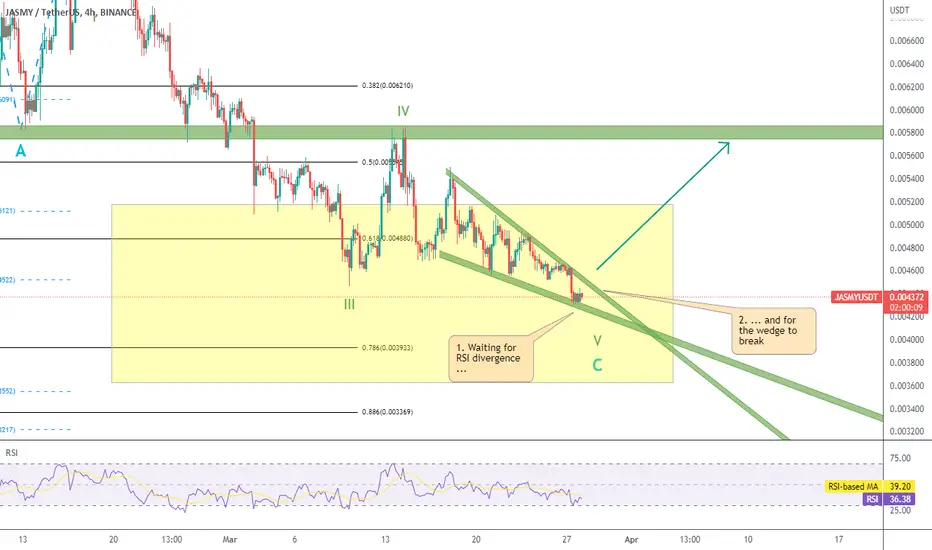
JASMY - Ending diagonal in playEven with prices falling since early February, I believe there is short-term hope for bulls.
Price is forming an ending diagonal (wedge formation), which in my primary count is wave V or wave C.
I'm waiting to see RSI divergence on the 4H chart, and a wedge breakout, for a long trade.
MOST MEN LIVE LIVES OF QUIET DESPERATION.We all know how price action works.
My message to you is look at the chart and see the patern.
We can see in this chart that there is volume and there is money in this coin.

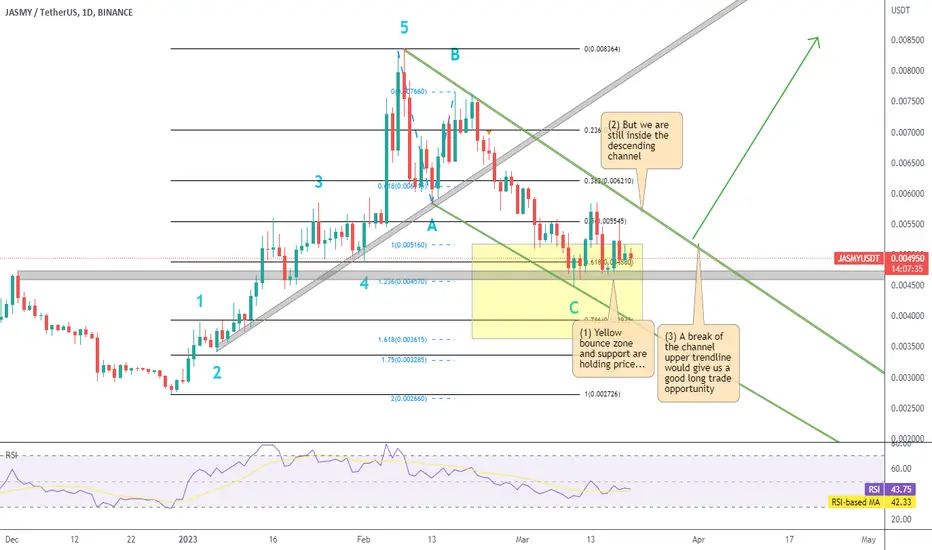
JASMY - Expected levels are holding price
JASMY price action has been sideways for the last 10 days, but I see the following key points to be noted:
Yellow Bounce Zone and Support: Price is being sustained by a yellow bounce zone and 0.0046 level acting as strong support. This prevents the price from falling further and provides a solid foundation.
Descending Channel: Despite the support, Jasmy remains inside a descending channel, indicating a prevailing bearish trend.
Break of the Upper Trendline: If the price manages to break through the upper trendline of the descending channel, it could signal a potential long trade opportunity, as the breakout might lead to a trend reversal or a significant upward move.
Jasmy Next ! stormy dayshi Jasmy can climb easily, I think if Bitcoin is green, maybe the first step is 0.01

JASMYUSDT (Daily) - Bearish breakoutHi Traders
JASMYUSDT (Daily Timeframe)
The market is in a downtrend and we are waiting for an entry signal to go SHORT below the 0.0045 support level. Only the upward break of 0.0059 would cancel the bearish scenario.
Trade details
Entry: 0.0045
Stop loss: 0.0059
Take profit 1: 0.0036
Take profit 2: 0.0024
Score: 4
Strategy: Bearish breakout


Jasmyusdt BTC CRYPTO WAKANDAWhat i really wish for; in the coming days after cpi
Jasmyn protocol exponential growth ahead
Now we are all aware that we are accumulating liquidity both side of the market
I wish to stay Neutral But an Old WISE MAN ONCE SAID
GO SHOPPING WHEN THERE IS BLOOD IN THE STREET
LMAO WARREN
ICT STUDENT

Jasmy looks delicious for a long Hi friends, I just checked out Jasmy Long and it looks very promising, respecting the trendline. The RSI is also indicating a potential pump from the trendline.
I'm expecting a 13% increase from here to .006251
Follow me for more charts
and please don't forget to like :)

JASMYUSDT 1H: INSIGHTAnalysis:
ICT Power of 3 spotted in JASMY 1H timeframe. Not a signal, enter at your own risk; no confirmation, no entry.

JASMYUSDT wants the bounce?JASMYUSDT is forming a falling wedge pattern on the 0.005 support area, which could potentially provide a bullish signal for traders.
A falling wedge is a chart pattern that occurs when the price of an asset forms a series of lower highs and lower lows, but the range between the highs and lows narrows over time. This creates a wedge-like shape on the chart, and is typically seen as a bullish reversal pattern.
In the case of JASMYUSDT, the falling wedge is forming on the 0.005 support area, which means that the price has been consistently testing this level but has not been able to break below it. This could indicate that there is strong buying pressure at this level, and that traders are looking to enter the market.
For a potential bullish breakout to occur, the price of JASMYUSDT needs to create a breakout from the 0.006 resistance level, which has previously acted as a key level of resistance. If the price manages to break above this level and confirm it as a new support level, this could provide a strong bullish signal for traders.
According to Plancton's rules, a set of technical analysis rules used by traders, a breakout from the falling wedge pattern combined with a confirmed breakout above the 0.006 resistance level could indicate a new long position for traders.
–––––
Follow the Shrimp 🦐
Keep in mind.
🟣 Purple structure -> Monthly structure.
🔴 Red structure -> Weekly structure.
🔵 Blue structure -> Daily structure.
🟡 Yellow structure -> 4h structure.
⚫️ Black structure -> <= 1h structure.
Follow the Shrimp 🦐

JASMYUSDTPERP LONGJASMYUSDTPERP 1H TF is in bullish trend creating higher highs and higher lows, we can take a long entry for this pair as Entry, SL & TPs are mentioned on the chart.

JASMYUSDT long-term uptrend starts hereWhile we have a very conservative upside target, JASMY should fly in the coming weeks. It seems we have bottomed out and buyers are on the hunt.


$JASMY - Long Idea.Odin Zone. I can finally give away this awesome looking setup. With an astonishing 35:1 RR, this one is a no brainer.
Keep in mind that this could take 2-3 weeks to play out, and we're not safe from the black swan event. So putting the SL will be super important, as well as having a plan B for if that SL hits: There are other entries to be had as well, the .786 zone has some confluence as well.
Looking the macro count, where you can see I have the initial bearish move being done, with the 1st wave of the new impulse also done, barring a Black Swan event. If we zoom in a bit... we see the subwaves of C. So depending on whether C is a diagonal or an impulse, that will determine the timing of our entry hitting.
I won't provide the exact numbers for the ideas here, you'll have to look on the chart.
Safe trades to all, and don't forget your SLs.

JASMY - Correction underwayThis token has made an impulsive 5-wave sequence to the upside, and is now in correction mode.
Wave A seems to be finished, and wave B´s format is not yet finished.
The price reached by wave B and the ascending trendline holding (or not) will define how deep the correction will go.
I personally prefer a break of the trendline and a test of 50% to 61.8% retracement in order to have long trades with better probability and confidence.

JASMY Still consolidating inside this Symmetrical Triangle and soon we See a Breakout in case Breakout to the upside Masseure technical target Should be 0.012$
All the best Guys
I gave this JASMY Setup when it was Trading 0.0037$ I’m attaching Pervious Analysis as well
I do deserve a Like and Kindly Follow

Cup & Handle Forming??I've been watching JASMY over the past few days and though it hasnt been gaining momentum it seemed to be consolidating. When I zoomed out to a bigger time frame I seen this which seems to be an obvious cup forming. Hoping to get some consolidation for the bigger move to the upside. What do you think?

Jasmy expected move Jasmy holding major s&r area with good volume
And ready for a 50% move if Bitcoin reamin bullish Jasmy clear move expected.
Target's
0.0084
0.0094
0.01045
0.01900
Buy and hold in spot
DYOR


