JASMYUSDT 4D AnalysisJASMY ~ 4D Analysis
#JASMY Buy gradually after retesting this support block with a short term target of at least 15%+ from here.
JASMYUST trade ideas

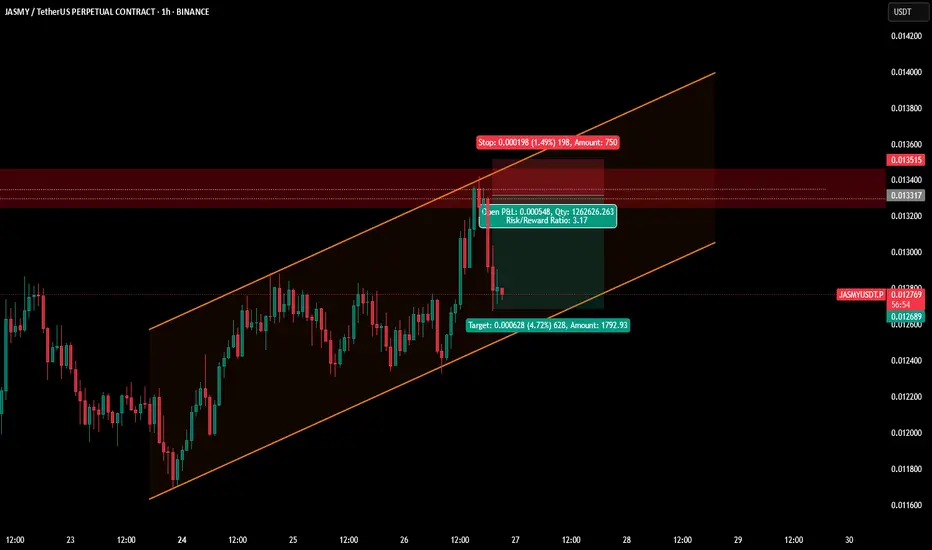
#JASMY/USDT#JASMY
The price is moving within a descending channel on the 1-hour frame, adhering well to it, and is heading towards a strong breakout and retest.
We are experiencing a rebound from the lower boundary of the descending channel. This support is at 0.01480.
We are experiencing a downtrend on the RSI indicator, which is about to break and retest, supporting the upward trend.
We are in a trend of consolidation above the 100 moving average.
Entry price: 0.01530
First target: 0.01593
Second target: 0.01650
Third target: 0.01720

jasmy/usdtWe're looking to go long on JASMY/USDT as it's approaching the 0.1550 Fibonacci level, which aligns with key dates identified through Gann analysis. This level is likely to act as a magnet for price action or serve as a potential reversal point.
In addition to the Fibonacci confluence, we’re watching a descending trendline that has been guiding the recent downtrend. Our trade entry will be based on a confirmed breakout of this trendline, which would signal a shift in momentum and support our bullish bias.
This setup combines time-based analysis (Gann), price levels (Fibonacci), and structure (trendline breakout), giving us a high-probability trade opportunity. As always, manage risk properly and wait for confirmation before entering.

Will #JASMY Retest Trigger a Rebound or a Breakdown? Key LevelsYello Paradisers! Have you prepared yourself for what’s about to unfold with #JASMYUSDT? The #JasmyCoin setup is showing signs of a major move:
💎#JASMYUSD has just completed an impulsive move from the Major Demand Zone around 0.01509 and is currently retesting the ascending support after breaking down from the short-term channel. This is the critical moment where disciplined traders prepare their next move, not after the bounce, but before it.
💎What we’re seeing now is a textbook retest of the ascending support, after an aggressive move from the major demand zone. The price is currently hovering just above the 0.01742 support level, a critical area that aligns with the high-volume node from the visible range volume Profile (VRVP), making this a high-probability reaction zone.
💎If the #JASMY price holds here, and we start seeing buyer strength reclaim the broken ascending channel, this could trigger a sharp bounce targeting the mid-term resistance at 0.02221. Above that, the next magnet will be the major resistance sitting around 0.02512, a level likely to attract profit-taking or even large-scale short entries from smart money.
💎However, failure to hold this support and a confirmed breakdown below the 0.01509 zone would invalidate the bullish structure entirely. In that case, we would be looking for a possible bearish continuation, driving the price toward 0.01400 and possibly lower, where more liquidity pockets remain untapped. That move would also trap late long entries and clean out weak hands — the exact kind of shakeout we warn about.
Play it safe, respect the structure, and let the market come to you!
MyCryptoParadise
iFeel the success🌴

GOOD TIME TO BUY JASMY I MARK THE TARGETSHello, the best opportunities are coming, don't forget it's not investment advice, but do your search for your best answer, greetings RAP

jasmy usdt trade ideajasmy fans out there.
good entry level at the prices marked in white and blue. there is liquidty issue with fair value gaps.
also, for it to break previous high and go to massive targets. it will definately need to hit the demand levels where the major players will be waiting.
according to fibs and other technical aspects that not many people look for. i m combining all and marking 3 prices below.
notice how tp1 was marked at the long arrow where the small trade played out.
tp2 is a bigger target that can be hit nicely if it comes down first. and i do believe it will. set alerts at 0.019 for confirmation.

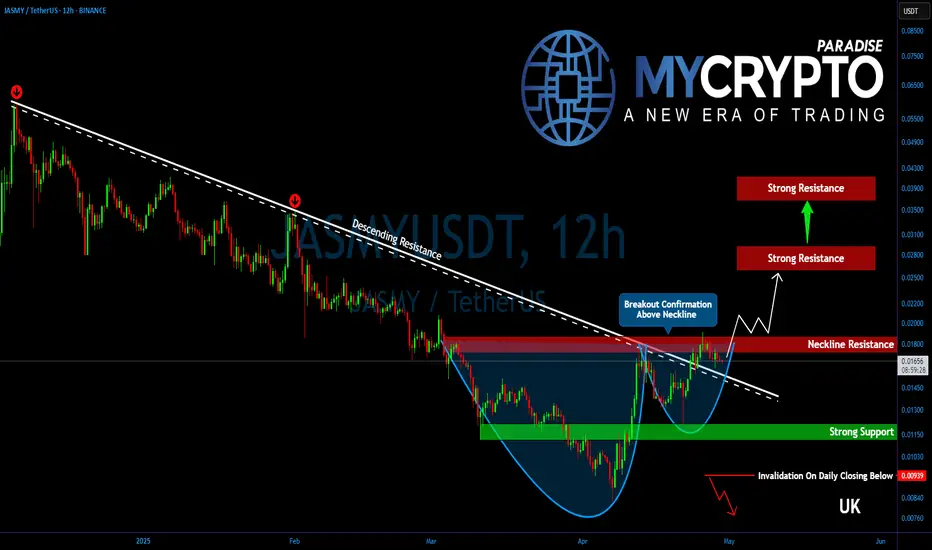
Is JASMY Ready for a Massive Comeback? Key Levels to Watch!Yello, Paradisers! After months of relentless selling, could #JASMY finally be staging a comeback? Let's dive into its key technicals:
💎After an extended and painful downtrend, JASMY has finally broken out of its multi-month descending trendline resistance. This significant technical breakout marks the first step toward a potential broader recovery. Moreover, the price action is shaping a potential cup and handle formation—a powerful bullish continuation pattern—which strongly suggests that the recovery momentum still has further room to run.
💎At the moment, #JASMYUSDT is battling a crucial resistance zone between $0.01750 and $0.01850. This area serves as the neckline resistance of the developing bullish structure. A clean and convincing breakout above this zone would trigger a major shift in momentum, potentially setting up JASMY for a back-to-back bullish breakout.
💎Should bulls succeed in pushing above this resistance, the next immediate target lies at $0.02500 to $0.02750—a heavy supply zone that coincides perfectly with the 50% Fibonacci retracement. This level is expected to attract some strong profit-taking.
💎However, if bullish strength continues to hold firm even after that, JASMY could extend its rally toward the 61.8% Fibonacci retracement zone, located around $0.03650 to $0.04000. This region is historically known to be a "golden pocket" for reversals and thus demands maximum caution. If signs of exhaustion emerge near this zone, it could potentially mark a medium-term top.
💎JASMY’s first primary support now sits at $0.01500. Below that, a firmer, more critical support base exists between $0.01150 and $0.01100—a zone that has already proven capable of withstanding strong selling pressure in the past.
Paradisers, strive for consistency, not quick profits. Treat the market as a businessman, not as a gambler.
MyCryptoParadise
iFeel the success🌴
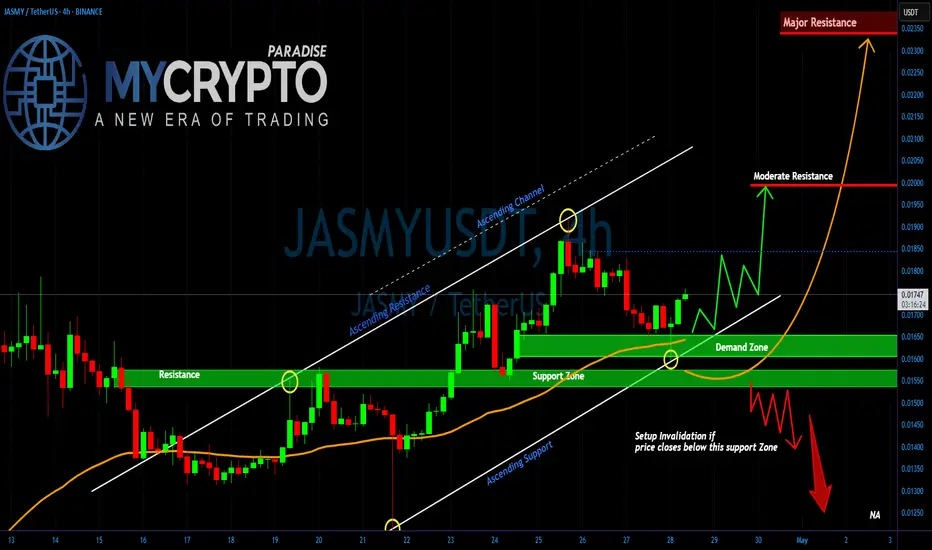
JASMY at a Breaking PointYello, Paradisers! Have you been watching JASMY closely? If not, you might be about to miss one of the most explosive opportunities we've seen in recent days. A major breakout or breakdown is brewing, and the market is preparing for a decisive move!
💎Right now, #JASMYUSDT is sitting above a critical Demand Zone after successfully flipping a strong historical resistance into support. Price action is following an ascending structure, respecting both the Ascending Support and the broader Ascending Channel pattern. As long as the price continues to hold this support region and maintain the bullish market structure, there is a high probability of a breakout towards the Moderate Resistance level around 0.01994. A clean break above this area could fuel a sharp rally straight towards the Major Resistance zone at 0.02337.
💎However, caution is absolutely necessary here. If JASMY fails to hold the current Demand Zone and we see a confirmed close below the support at 0.01540 level, it would invalidate the bullish setup. In that case, a rapid sell-off is likely, with downside targets opening towards the 0.01397 region and possibly even lower levels. This would create a high-risk environment where inexperienced traders could get trapped very quickly.
Stay focused, Paradisers. Be the hunter, not the hunted.
MyCryptoParadise
iFeel the success🌴
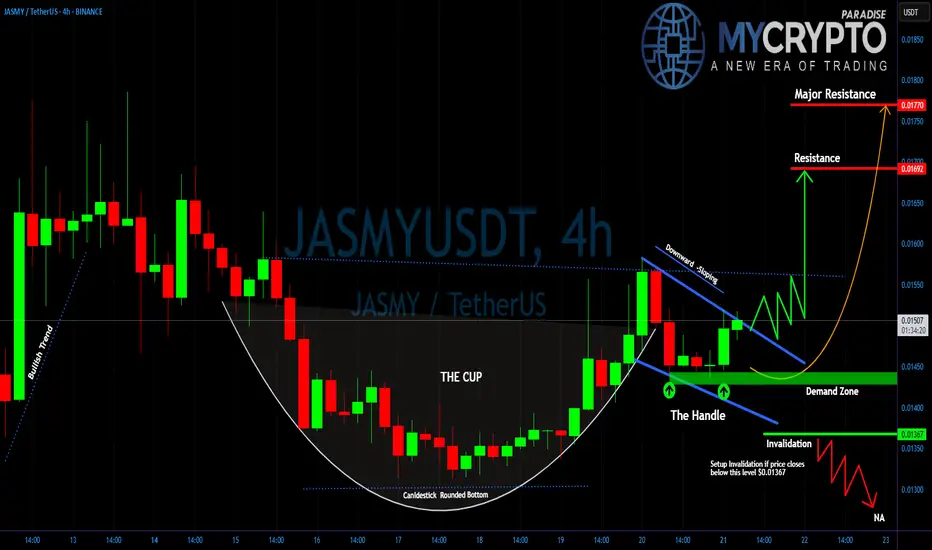
JASMY: Will You Catch the Breakout or Get Caught in the Trap?Yello Paradisers, did you catch the textbook pattern quietly forming on JASMY while most of the market remains distracted? Because what comes next could catch the majority off guard.
💎#JASMYUSDT is currently forming a classic Cup and Handle pattern. After a strong impulsive move, the price retraced in a rounded bottom structure, completing what now looks like the cup. The current consolidation has created the handle a downward-sloping corrective move that’s showing early signs of exhaustion.
💎What adds even more strength to this setup is that the price is now trading above both the 50 EMA and 200 EMA on the 4H timeframe. This signals a solid bullish bias and confirms that the overall momentum remains in favor of the bulls. When the price holds above both moving averages during a consolidation phase, it often indicates that a strong continuation move is brewing.
💎The price is also respecting a well-defined demand zone between 0.01430 and 0.01450. As long as this area holds, the probability of a bullish breakout remains high. A break above the descending handle resistance will be the first true confirmation.
💎If that breakout is supported by volume and sustained price action, we expect a move toward the first resistance at 0.01698. Beyond that, the final target for this pattern lies at the major resistance zone around 0.01785, where significant selling pressure could return. However, discipline is key. If JASMYUSD breaks below 0.01367, the handle structure would be invalidated.
Stay focused, Paradisers. Be the hunter, not the hunted
MyCryptoParadise
iFeel the success🌴
Jasmy Coin waiting for the next green CandleWaiting for the next green Candle and then we go to the moon ;-)

JASMY Falling Channel BreakoutBINANCE:JASMYUSDT just broke out of its falling channel, with strong volume despite it being a weekend move, and is attempting to reclaim the previous support zone around $0.016.
Observations
• Second clear breakout from a descending structure in the last year.
• Good volume spike backing the move — first meaningful demand since the December peak.
• Attempt to reclaim the $0.016 support zone, which had acted as a base throughout 2024.
Key levels
• A daily close above the resistance would confirm the breakout.
• Holding above ~$0.016 would be an even stronger bullish sign.
• Next major resistance at $0.041-$0.045 from the previous supply zone.
• Watch the 1-year EMA above $0.021 as a potential shorter-term resistance.
If momentum continues, this could be the start of a larger trend reversal, with $0.041 as the first upside target.

JASMY SHORT NOW ALL trading ideas have entry point + stop loss + take profit + Risk level.
hello Traders, here is the full analysis for this pair, let me know in the comment section below if you have any questions, the entry will be taken only if all rules of the strategies will be satisfied. I suggest you keep this pair on your watchlist and see if the rules of your strategy are satisfied. Please also refer to the Important Risk Notice linked below.
Disclaimer

#JASMY: Unlocking Data Ownership in IoT**Description**:
This trading idea highlights **JASMY**, a blockchain-based platform aiming to revolutionize the Internet of Things (IoT) sector by empowering users with full control over their personal data. Based in Japan, **JASMY** blends IoT technology with decentralized data management, offering a secure infrastructure where individuals and businesses can safely store, manage, and monetize their data. With increasing concerns over data privacy and the expansion of smart devices, **JASMY** is strategically positioned to capitalize on both trends. The project also enjoys strong corporate backing and regulatory alignment, especially in the Asian market, adding to its long-term appeal.
Still, the crypto market is highly volatile, and factors such as regulation, adoption rates, and technological evolution can significantly influence **JASMY**'s price and utility. As with all digital assets, investing in **JASMY** requires a balanced approach and awareness of the inherent risks.
**Disclaimer**:
This trading idea is intended for educational purposes only and does not constitute financial advice. Cryptocurrencies like **JASMY** carry significant risk, including the potential loss of capital. It is crucial to conduct your own thorough research, assess your financial position, and consult a licensed financial advisor before making any investment decisions. Past performance is not indicative of future results.

JASMY ANALYSIS (1D)Before anything else, you should know that this token is on Binance’s Red List (at risk of being delisted) and carries its own specific risks.
After entering a corrective phase, JASMY is now approaching a FLIP zone.
From this level, we expect upward volatility for JASMY.
Targets are marked on the chart.
A daily candle closing below the invalidation level will invalidate this analysis.
For risk management, please don't forget stop loss and capital management
When we reach the first target, save some profit and then change the stop to entry
Comment if you have any questions
Thank You

Jasmy 4 months downtrendOn daily time frame shows 4 months downtrend. Currently breaking out of the downtrend resistance. Will it sustain the breakout?

JASMY/USDT: Bullish Breakout and Long OpportunityHello fellow traders,
I've spotted a promising long opportunity on JASMY/USDT that I wanted to share with you.
Here's the setup:
Breakout Confirmation: JASMY has successfully broken out of a descending channel, indicating a potential shift in momentum.
Retracement and Readiness: Following the breakout, the price has retraced, suggesting it's now poised for an upward move.
Target: My target for this trade is the $0.01250 level, which conveniently aligns with the 200-period moving average on the 4-hour timeframe.
Here's my proposed trade plan:
Entry: I'm looking to enter the trade once the price moves above $0.01060.
Stop Loss: To manage risk, I've set my stop loss around $0.00970.
Remember, this is just my analysis, and trading always carries risk. Please do your own due diligence before making any trading decisions.
Wishing you all profitable trades!

JASMY support and early indicators for price changeJasmy,
Here you go, there is an early sign for the price change, see RSI and difference between marked points, also the support zone and 1D candle, trade is with a small risk S/L as indicated 0.0904 t/p 0.015 although who knows? This might be early sign for the change in money investment and capital might just recognise this undervalued projects!
Anyway, this is not a trading advise just an idea- protect your capital, good luck

JASMY Trade SetupSEED_DONKEYDAN_MARKET_CAP:JASMY can be a good long here. I am taking my chance if it gets to my entry. I will be trading it with tight stoploss. Stoploss is very important while trading in such market conditions.

JASMYUSDTmy entry on this trade idea is taken from a point of interest below an inducement (X).. I extended my stoploss area to cover for the whole swing as price can target the liquidity there before going as I anticipate.. just a trade idea, not financial advise
Entry; $0.01189
Take Profit; $0.01090
Stop Loss; $0.01220
HAPPY NEW MONTH, WISH YOU DREAMS COME TRUE.

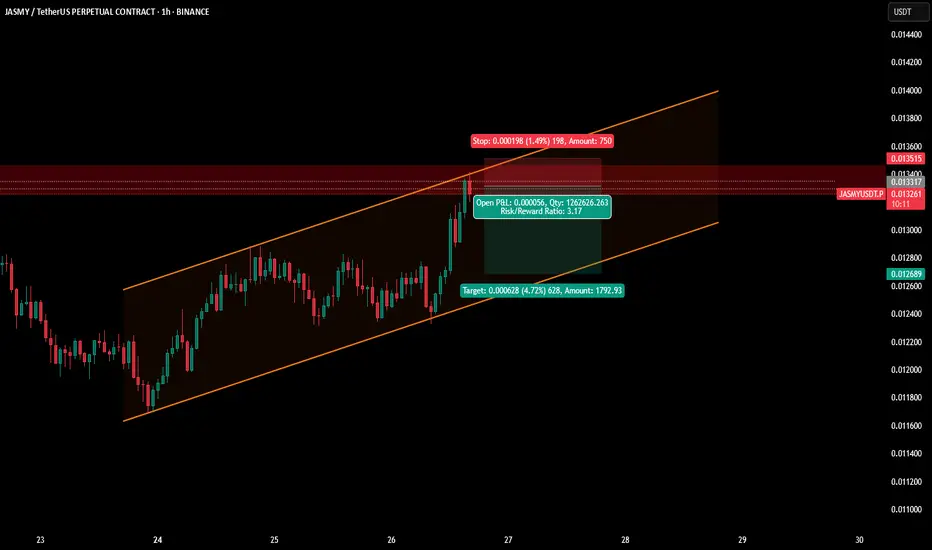
#JASMY/USDT#JASMY
The price is moving within a descending channel on the 1-hour frame, adhering well to it, and is on its way to breaking it strongly upwards and retesting it.
We are seeing a bounce from the lower boundary of the descending channel, this support at 0.1233.
We have a downtrend on the RSI indicator that is about to break and retest, supporting the upward trend.
We are looking for stability above the 100 moving average.
Entry price: 0.01279
First target: 0.01300
Second target: 0.01327
Third target: 0.01360

Jasmy Trade Update:1:3 Trade Done BINANCE:JASMYUSDT.P
Shared earlier here on my profile. More to come!
Jasmy Trade IdeaSEED_DONKEYDAN_MARKET_CAP:JASMY has got rejected from the trendline resistance. I am eyeing an entry on the pullback.
Jasmy $0.34 Target Personal Prediction.Hello, hope you're all doing well.
What I have for you guys today is a personal prediction of where I see Jasmy going. Again, as with all my posts, I advise each and every one of you to take a look and come to your own conclusions, As I usually tend to take an unconventional approach towards my analysis.
I've labeled with arrows and text to show you when I believe these targets may be hit.
Thanks - ZangTrades
